
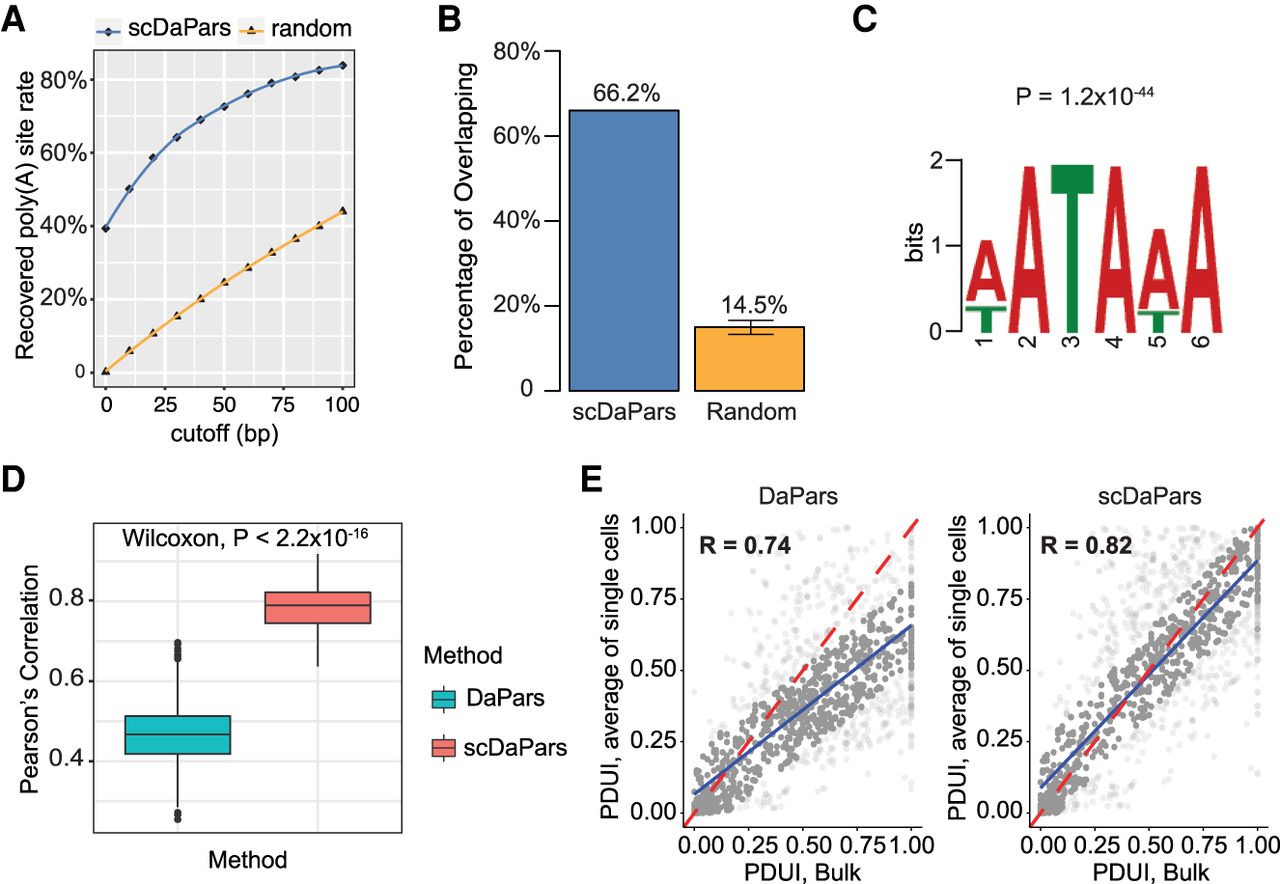
Evaluation of APA detection accuracy of scDaPars using human PBMCs data sets. (A) Fraction of poly(A) sites predicted in matched bulk RNA-seq data recovered in single cells using scDaPars or random control. Poly(A) sites predicted in scRNA-seq are considered true if they are located within cutoff distance from the bulk results. The cutoffs range from 0 to 100 bp with 10-bp increments. (B) Percentage of scDaPars predicted poly(A) sites or random control overlapped with annotated poly(A) sites from RefSeq, Ensembl, UCSC gene models, and poly(A)_DB. The confidence interval was derived by taking random sites 10 times. (C) The top-scoring signal identified by de novo motif analysis (DREME) from the upstream (−100 bp) of scDaPars predicted poly(A) sites from single cells. (D) Box plot showing Pearson's correlations between PDUI values of B cell pairs estimated by DaPars and scDaPars (Wilcoxon test P < 2.2 × 10⁻¹⁶). (E) Scatter plots of PDUI values between the average of all single cells and bulk results estimated by DaPars (left) and scDaPars (right). Red line represents the theoretical linear relationships between bulk and average of all single-cell PDUIs, and blue represents the actual linear relationships estimated from data.


