
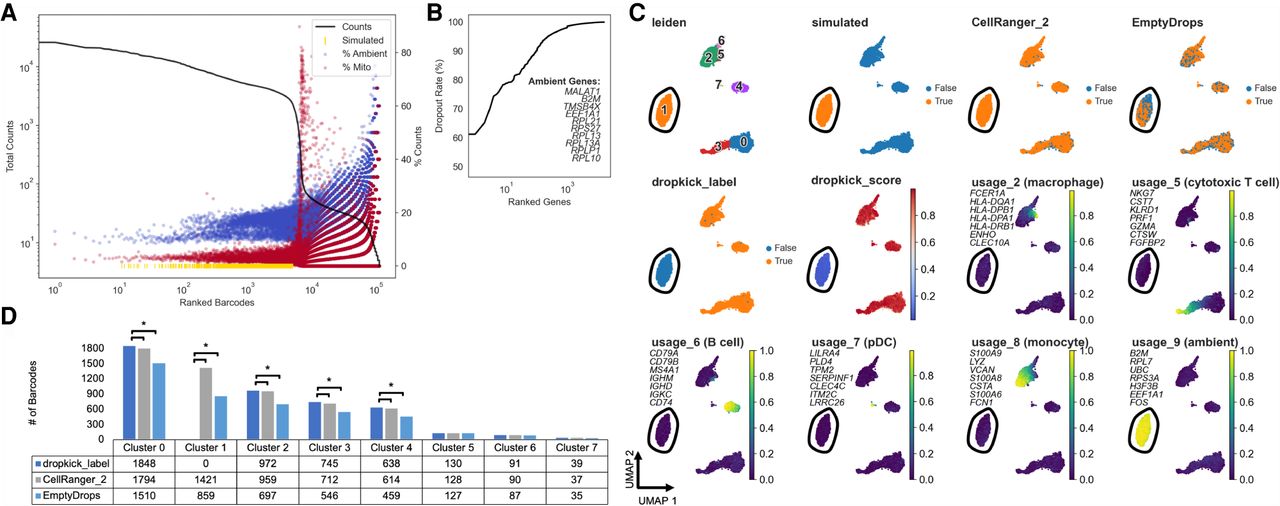
Benchmarking dropkick performance on simulated high-background data. (A) Log-rank total counts curve for the high-background PBMC simulation. The horizontal dashed line indicates the threshold below which ground-truth empty droplets were used to build simulated barcodes from a multinomial distribution (100 total counts). Gold rug plot indicates the location along the total counts curve of 2000 simulated high-UMI droplets (see Methods: High-Background PBMC Simulation). (B) Genes in PBMC simulation ranked by dropout rate. Top 10 ambient genes are listed, defining ambient profile used to calculate percentage in A. (C) UMAP embedding of all barcodes kept by dropkick_label, CellRanger_2, and EmptyDrops. Points colored by each of the three filtering labels, Leiden clusters determined by NMF analysis, dropkick score (cell probability), and select cell type metagene usages from NMF. Top seven gene loadings for each NMF factor are printed on their respective plots, in axis order from top to bottom. Circled area shows independent cluster of simulated empty droplets. (D) Table and bar graph enumerating the total number of barcodes detected by each algorithm in all NMF clusters. Significant cluster enrichment as determined by sc-UniFrac is denoted by brackets.


