
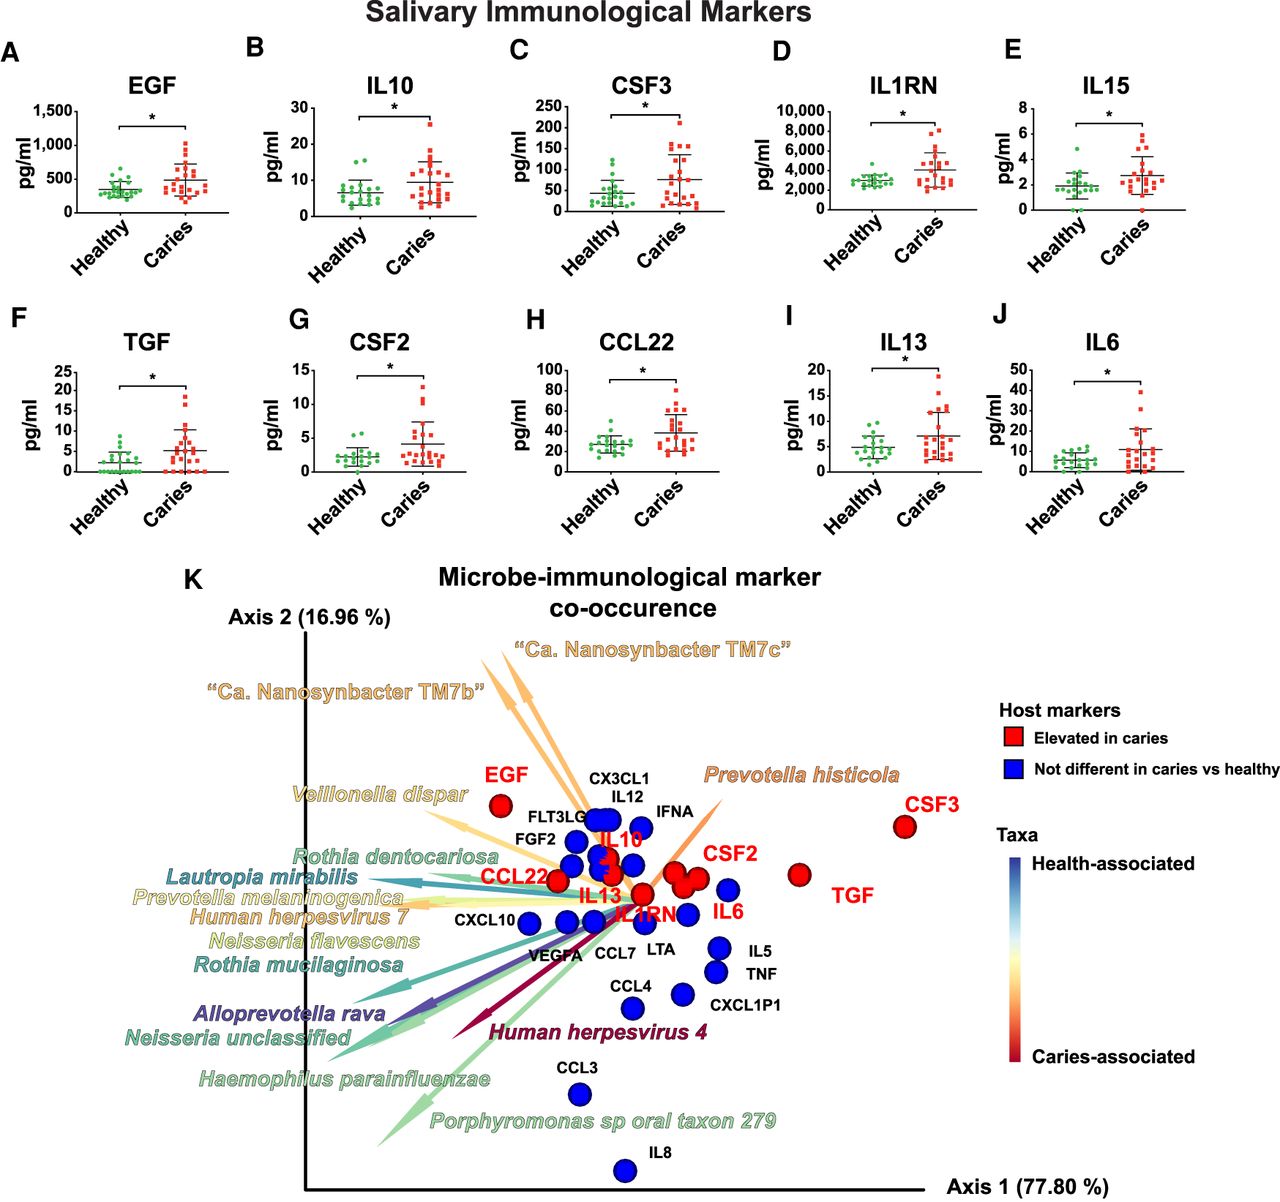
Significant differences in the salivary immunological profile of healthy children and children with caries. (A–J) Scatter plots illustrating the 10 immunological markers: (A) EGF, (B) IL10, (C) CSF3, (D) IL1RN, (E) IL15, (F) TGF, (G) CSF2, (H) CCL22, (I) IL13, and (J) IL6, which were significantly different between healthy and caries subject groups. (*) P < 0.05, based on a Welch's t-test. (K) Microbe-immune marker co-occurrence. Biplot illustrating the co-occurrence of oral taxa with immune markers. The 31 detected immune markers are represented by spheres, and the bacterial taxa are represented by vectors. Red spheres indicate host markers that were elevated in caries, whereas blue spheres indicate host markers that were not significantly different between caries and health (based on the Welch's t-test described in A–J). Vectors are colored by Songbird ranks (Fig. 4C) indicating association with caries versus health.


