
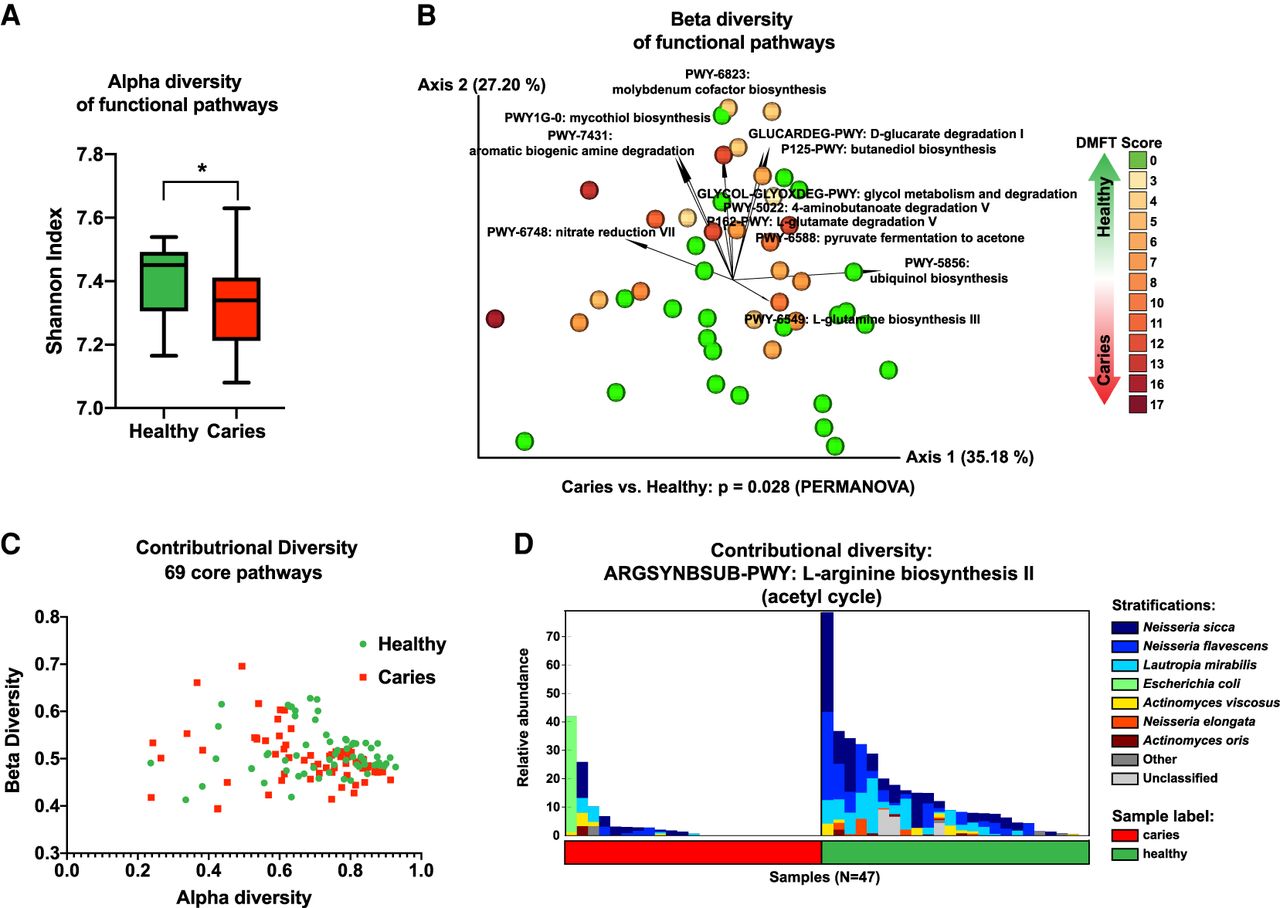
Profiling of functional pathways illustrates differences between health- and caries-associated oral microbiota. (A) A greater diversity of functional pathways is present in the healthy group. Bar chart illustrating the alpha diversity (Shannon Index) of the functional pathways present in the healthy and caries groups, as determined by HUMAnN2 (Franzosa et al. 2018) analysis. (*) Statistical significance based upon a Kruskal–Wallis test (P = 0.0136). (B) Beta diversity of functional pathways. Biplot generated using DEICODE (robust Aitchison PCA) (Martino et al. 2019). Data points represent individual subjects and are colored with a gradient to visualize DMFT score, indicating severity of dental caries. Feature loadings (i.e., functional pathways driving differences in ordination space) are illustrated by the vectors, which are labeled with the cognate pathway name. (C) Contributional diversity of 69 core pathways. Scatter plot indicating alpha and beta diversities of 69 functional pathways that were found across all samples. (D) Contributional diversity of arginine biosynthesis in caries versus health. Stacked bar chart illustrating the relative abundance and contributional diversity of arginine biosynthesis across the samples.


