
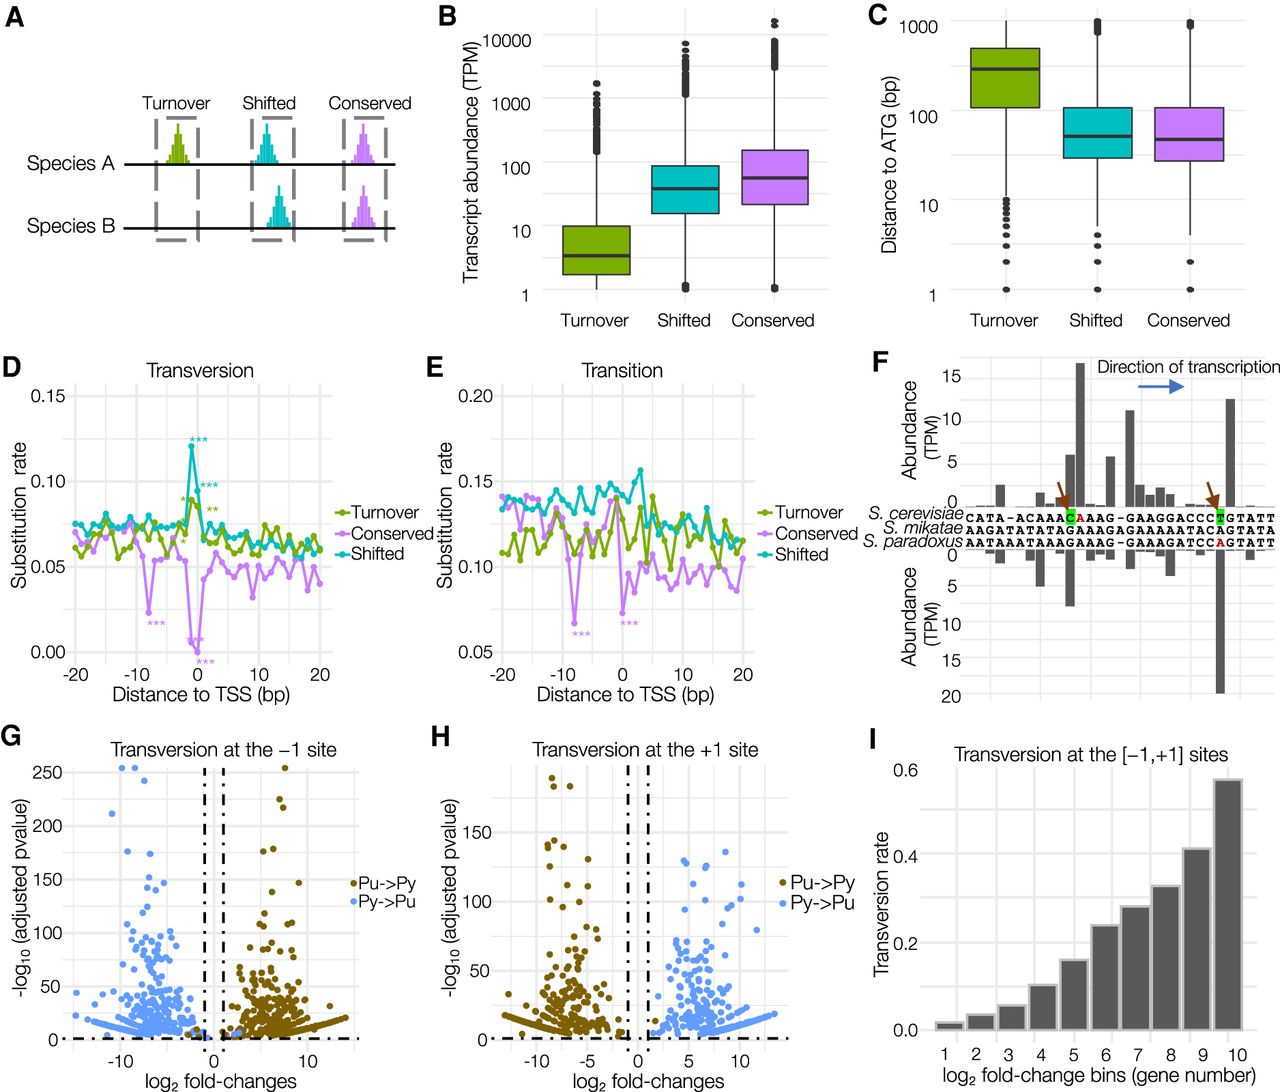
Genetic basis underlying the evolutionary divergence of core promoters and TSSs in budding yeasts. (A) A schematic diagram of three types of core promoters based on their evolutionary patterns. (B) Different transcriptional activities among the three types of core promoters. (C) The Turnover core promoters tended to locate more upstream from the ATG codon than the other groups. (D) The rate of transversion substitution at each site in the region surrounding the dominant TSS (from −20 to +20 bp), which were calculated between orthologous core promoters in S. cerevisiae and S. paradoxus. The sites with significantly higher or lower substitution rates are indicated by asterisks (chi-square test). (*) P < 0.01; (**) P < 0.001; (***) P = 0. (E) The rate of transition substitution at each site in the region centered around the TSS (from −20 to +20 bp). (F) An example of Shifted core promoters (upstream of YDL182W) and their genomic sequences in three closely related budding yeasts. New mutations in S. cerevisiae and S. paradoxus are indicated by arrows. (G) Volcano plot illustrating that mutations from pyrimidine to purine (Py → Pu) and from purine to pyrimidine (Pu → Py) at the −1 site have the opposite impacts on transcriptional activities of TSSs. The horizontal dashed line refers to the adjusted P-value of 0.05, and the vertical dashed lines indicate ≥1 or ≤−1 log2 fold-changes. (H) Volcano plot illustrates that mutations from pyrimidine to purine (Py → Pu) and from purine to pyrimidine (Pu → Py) at the +1 site have the opposite impacts on transcriptional activities of TSSs. (I) The TSSs with larger fold-changes in transcriptional activities are more likely to be associated with transversion mutation at the [−1,+1] sites.


