
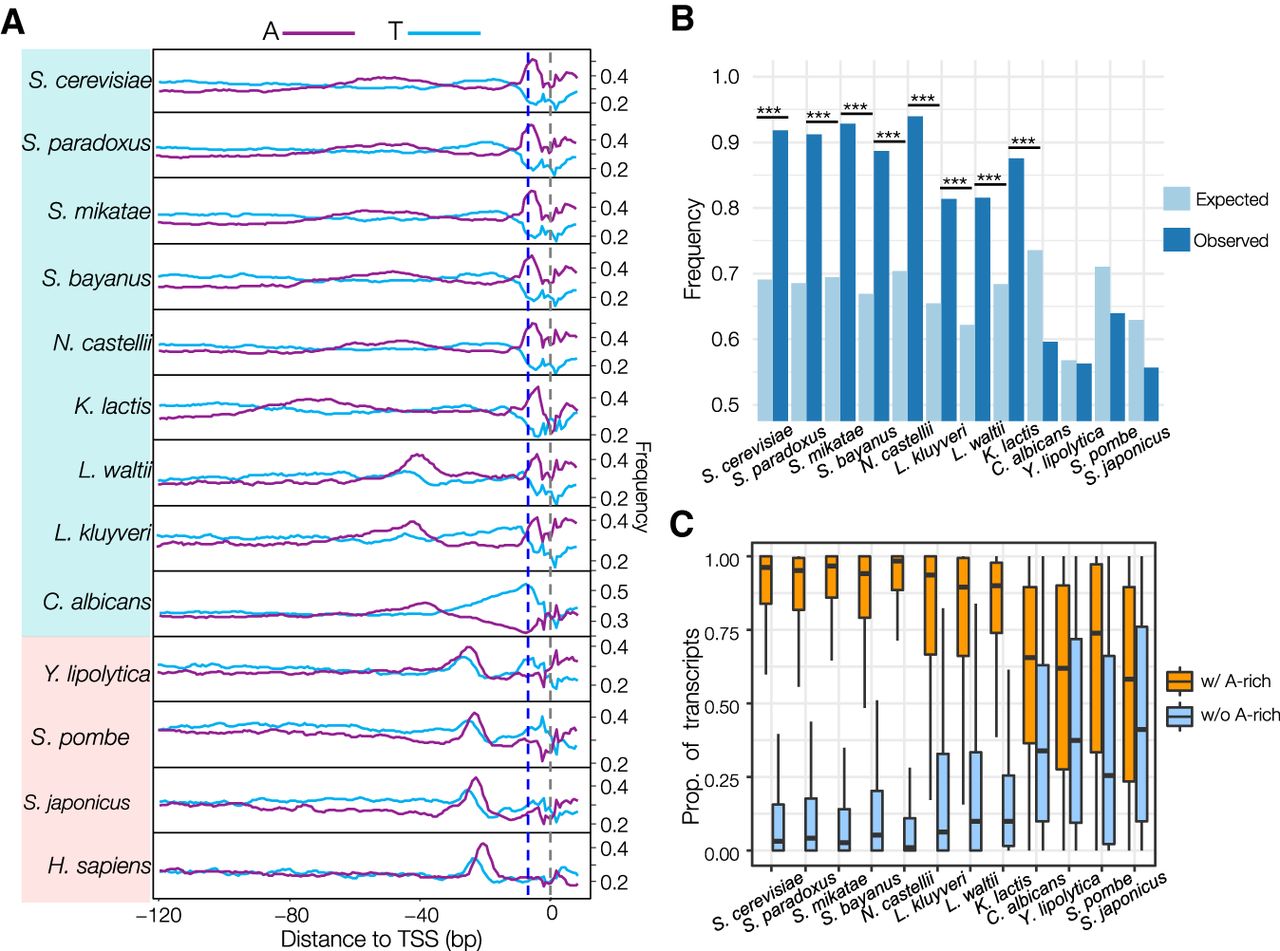
Presence of an adenine-rich (A-rich) region in the scanning-model species and its functions. (A) Sliding-window analysis of A/T frequencies in the region from −120 to +10 bp surrounding the dominant TSS of all core promoters in the 12 yeast species and human (Supplemental Dataset S13). The window size is 5 bp with a step size of 1 bp. Blue dashed line refers to the −8 site. The gray dashed line refers to the TSS position (the +1 site). (B) Frequency of expected and observed A-rich (at least two adenines) region in the window from −9 to −3 bp. (***) P = 0, chi-square test. (C) Proportions of transcripts initiated from TSSs with and without an A-rich region. This figure was generated based on all core promoters in the 12 species.


