
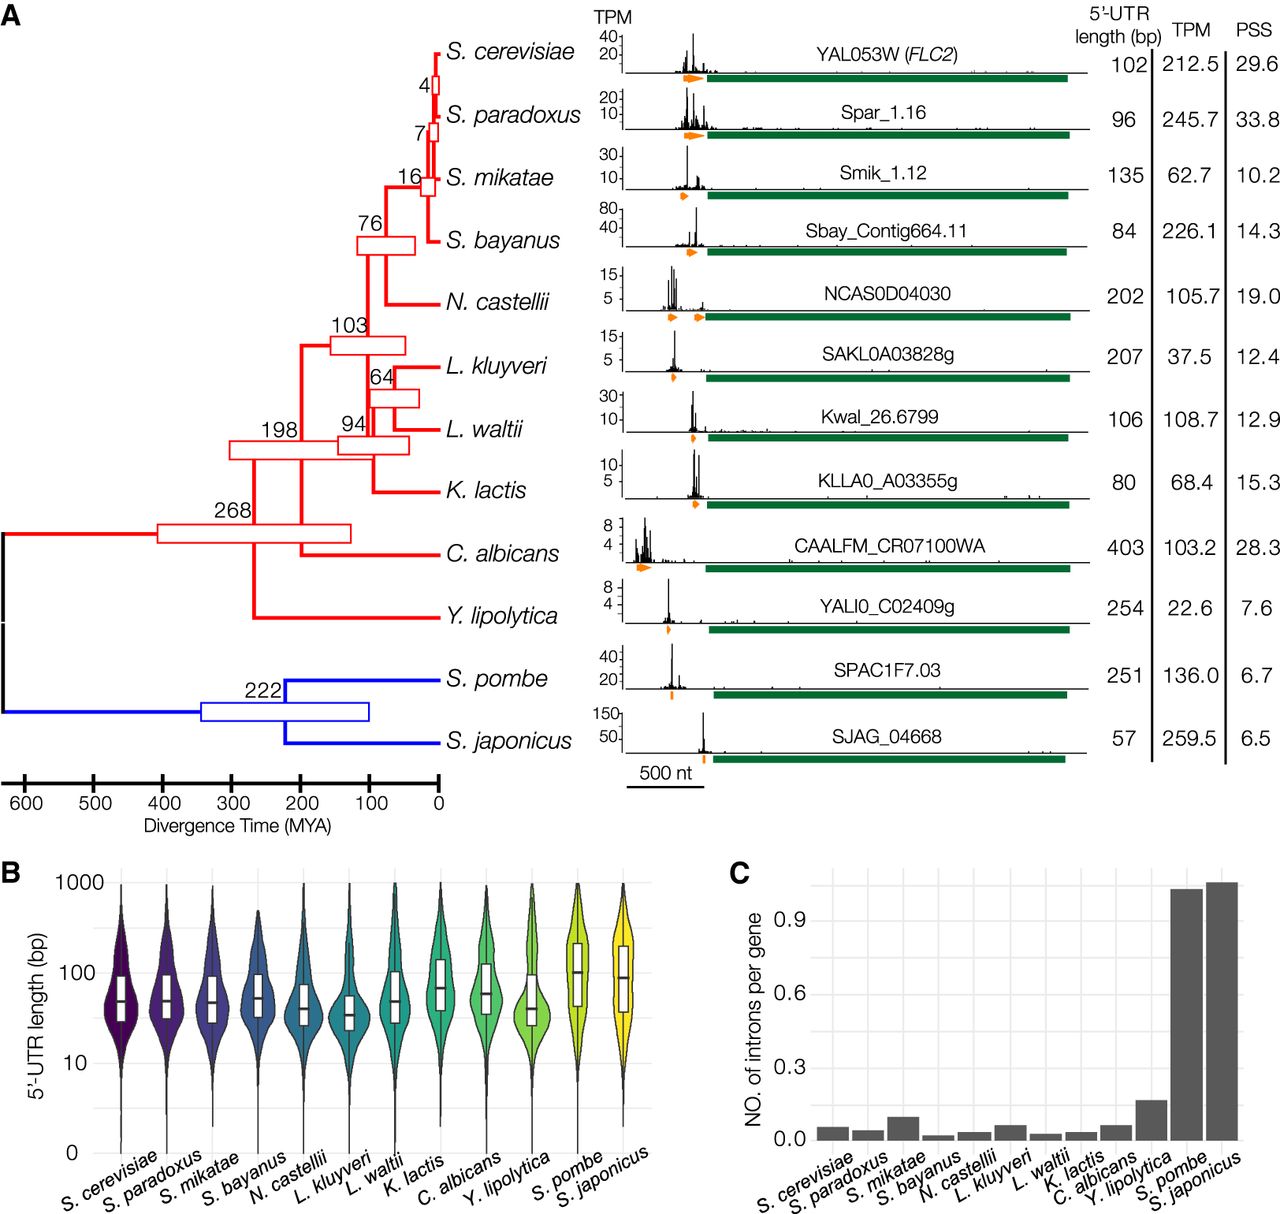
Generation of TSS maps at single-nucleotide resolution for 12 yeast species. (A) An example of TSS maps of orthologous FLC2 genes from 12 yeast species. We inferred the phylogenetic tree of the 12 yeast species based on RPB2 protein sequences, the largest subunit of the Pol II complex, using the maximum likelihood method. The full species names are provided in Supplemental Table S1. The estimated divergence times and 95% confidence intervals for all branching points in the tree are provided as numbers and horizontal bars, respectively. The tree was drawn to scale. In the TSS map of each species, the top track illustrates the distributions of TSS signals. The second track shows the locations and boundaries of core promoters (orange arrow) and the locations of gene coding regions (green bar). (B) Violin plot showing the distribution of 5′-UTR lengths in each species. (C) Number of introns per gene in each of the 12 yeast genomes.


