
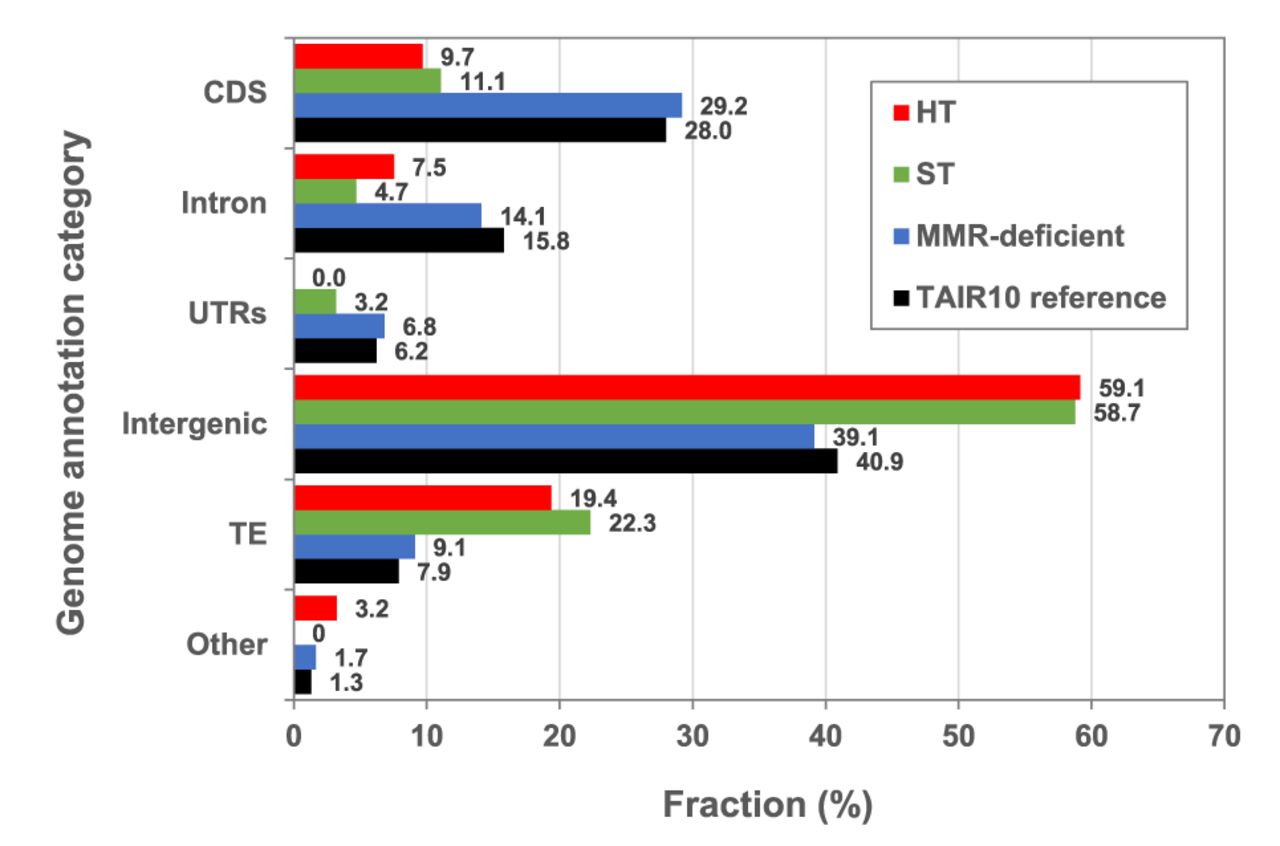
Figure 3.
Genome-wide distribution of SNVs in HT, ST, and MMR-deficient MA lines. Black bars show the relative distribution of Arabidopsis thaliana TAIR10 reference genome annotation categories (expressed as % of total genome). (CDS) Coding DNA sequence, (UTRs) untranslated regions, (TE) transposable element, (Other) noncoding RNAs and pseudogenes. The remaining bars show relative distribution (%) of SNVs in those annotation categories in: (red) HT MA lines (N = 92); (green) ST MA lines (N = 98) (Ossowski et al. 2010) and N = 44 (Jiang et al. 2014) (averaged for each category); and (blue) MMR-deficient MA lines (N = 4048) (Belfield et al. 2018).


