
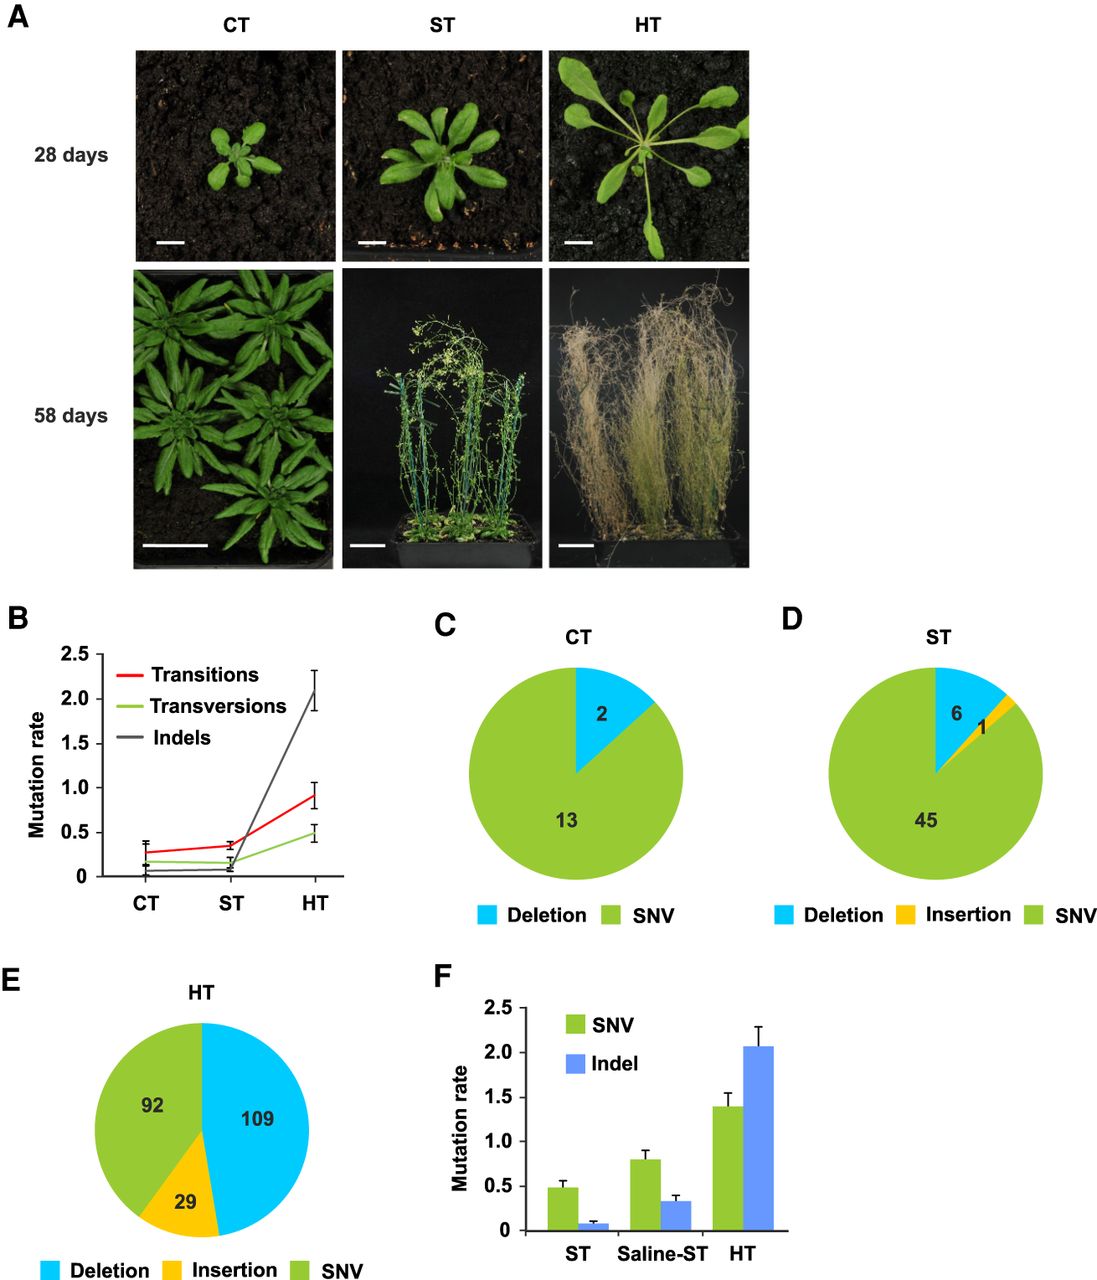
Stressful HT growth increases A. thaliana mutation rates. (A) Plants grown for 28 d or 58 d in cold (CT; 16°C), standard (ST; 23°C), or high temperature (HT; 29°C) conditions. HT-grown plants display characteristic high temperature developmental and stress responses. (B) Mutation rates (per genome per generation) for transitions, transversions, and indels accumulating in CT, ST (Jiang et al. 2014), and HT MA lines. (C) Overview of the 15 mutations detected at G6 in five independent CT MA lines. Deletions are 1 bp in size; SNVs are single-nucleotide variants (single-nucleotide substitutions). (D) Overview of the 52 mutations detected at G10 in nine ST MA lines from three independent lineages (Jiang et al. 2014). Deletions are 1–66 bp in size; insertion is 2 bp in size. (E) Overview of the 230 mutations (Supplemental Table 2) detected at G11 in six independent HT MA lines. Deletions are 1–22 bp in size; insertions are 1–5 bp in size. (F) SNV and indel mutation rates in ST (Jiang et al. 2014) and HT compared with those in salinity stress (Saline-ST) (Jiang et al. 2014). Error bars (B,F) indicate SEM from five (CT data), nine (ST data) (Jiang et al. 2014), nine (Saline-ST data) (Jiang et al. 2014), or six (HT data) biological replicates.


