
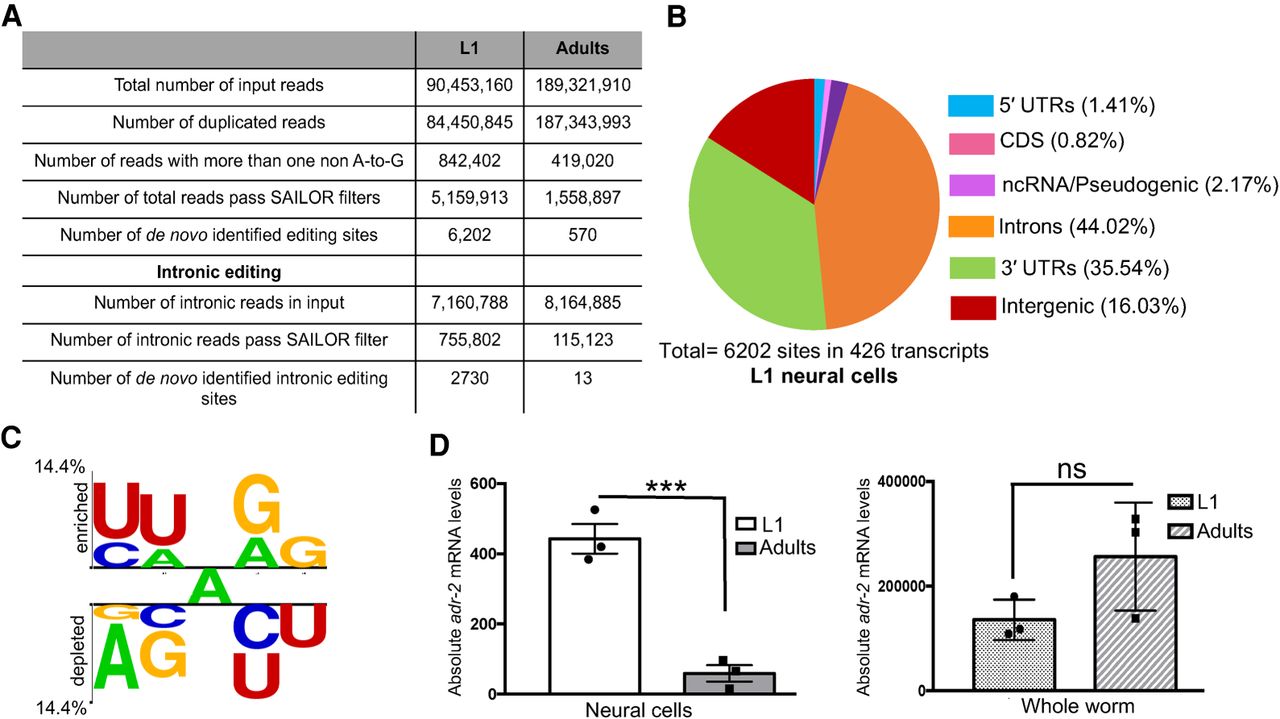
C. elegans neural editome change during development. (A) Comparison of the RNA-seq data sets from L1 and adult neural cells. The number of input reads for each step of the SAILOR bioinformatic pipeline is listed along with the number of de novo identified edited sites. (B) Genomic distribution of the identified L1 neural editing sites was determined using the WormBase annotations (WS275). (C) A Two Sample Logo analysis of editing sites identified in L1 neural cells compared with adenosines present in the same dsRNA region. Enriched and depleted nucleotides are shown above and below the axis, respectively. The level of conservation is represented by letter height. Logos were generated using a Student's t-test with P < 0.05 and no Bonferroni correction. (D) qPCR was used to quantify adr-2 expression in neural cells (left) and in whole-worm lysate (right) for both L1 and adults. The average of three independent replicates is plotted; error bars, SEM. Statistical significance was calculated using a Student's t-test. (***) P < 0.001; (ns) P > 0.05.


