
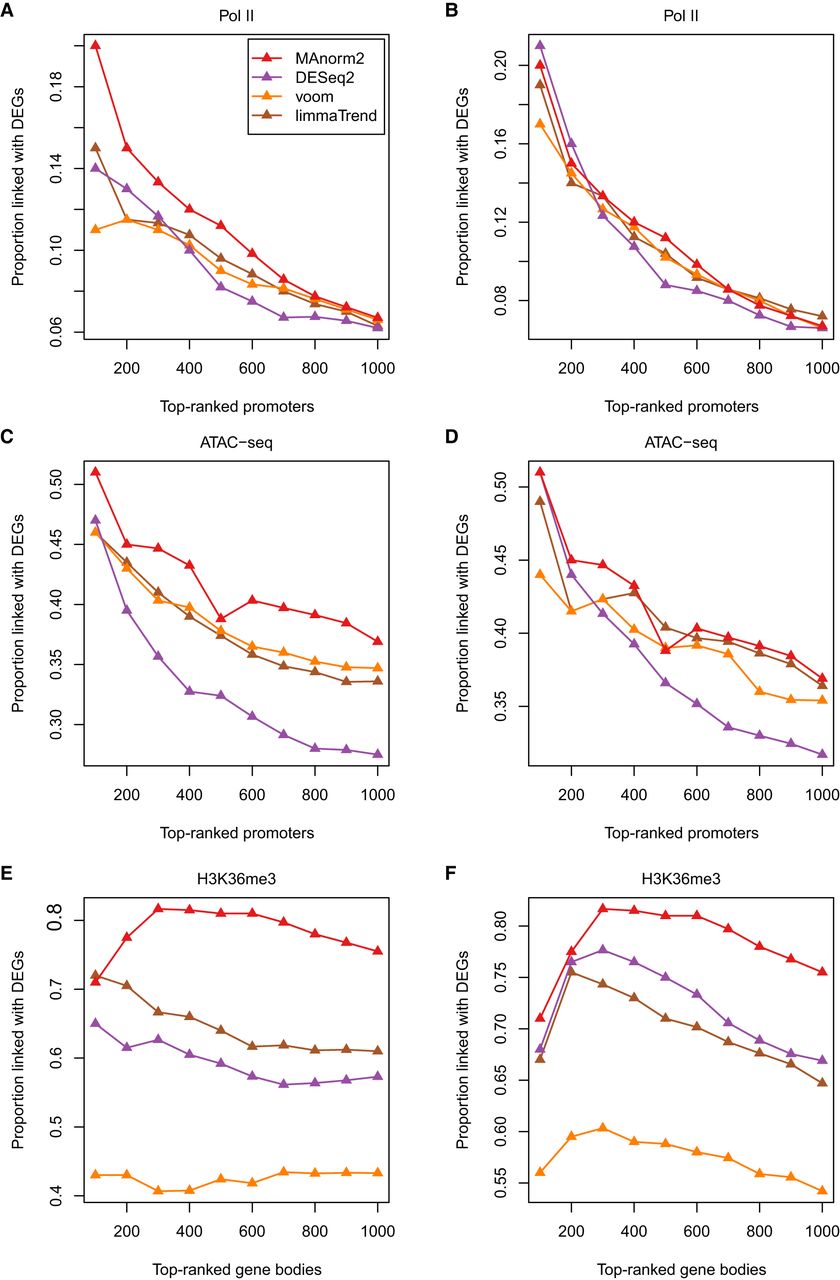
Figure 5.
Method comparison on additional data sets. (A,B) Differential analysis of Pol II ChIP-seq data between seven Japanese and seven non-Japanese LUAD cell lines. (C,D) Differential ATAC-seq analysis between 27 LUAD and nine LUSC patients. (E,F) Differential analysis of H3K36me3 ChIP-seq data between H1 and GM12891, each associated with two biological replicates. In this analysis, we selected for each gene the widest genomic interval overlapping its body. These intervals were then ranked separately by each method. In A, C, and E, methods are applied with their respective default normalization methods. In B, D, and F, methods are applied with hierarchical MA normalization.


