
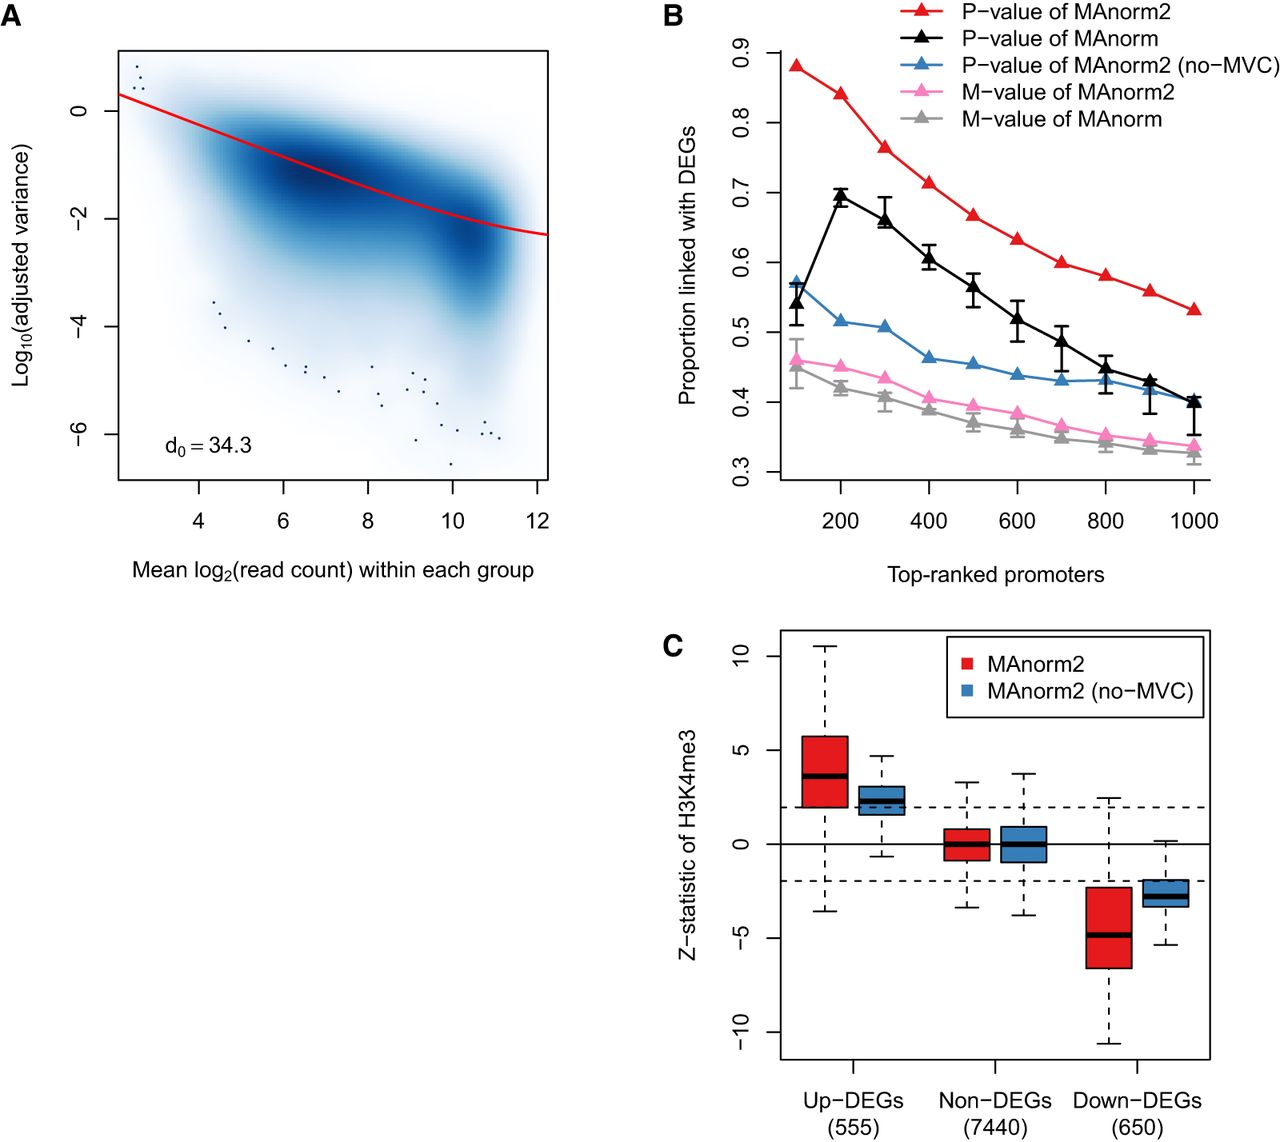
Modeling the mean-variance trend to improve variance estimation. (A) Scatterplot showing the mean-variance trend associated with the H3K4me3 ChIP-seq samples of GM12891 and GM12892. Red line depicts the fitted MVC, and d0 gives the estimated number of prior degrees of freedom. (B) In the identification of differential H3K4me3 levels between GM12891 and GM12892, the proportion of true discoveries among top-ranked promoter intervals is plotted against the number of top-ranked promoter intervals. DEGs were identified by applying DESeq2 to the corresponding RNA-seq data with a P-value cutoff of 0.01. MAnorm has been applied to all possible comparisons of two individual samples of GM12891 and GM12892, respectively, and we show here the median as well as the first and third quartiles of the true discovery proportions achieved in the total nine comparisons. (C) Box plots for z-statistic equivalents of the P-values assigned to promoter regions of DEGs and non-DEGs. Dotted lines correspond to a two-tailed P-value of 0.05. Non-DEGs were defined as the genes with a DESeq2 P-value larger than 0.5 and a fold change less than 2.


