
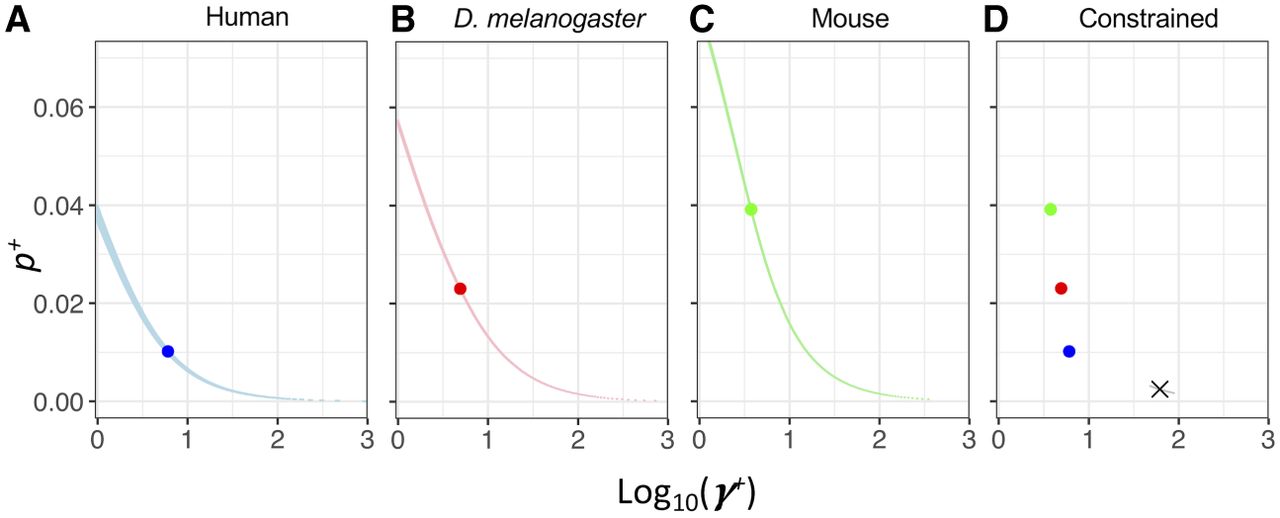
Figure 5.
LL surfaces for p+ and γ+ for different species: (A) human; (B) D. melanogaster; and (C) mouse. (D) The constrained model, H0, in which p+ and γ+ are constrained to be the same across all three taxa. LLs are calculated using a grid search method of log10(γ+) in the range of 0–3 and p+ in the range of 0%–7.5%. Blue denotes human; red, D. melanogaster; and green, mouse. The large points represent the MLE for each species; the black cross in panel D represents the MLE of the constrained model; and the lighter colors show grid points within three LL units of each MLE. The Complex model is used for each species, and we use chimpanzee as the outgroup for humans.


