
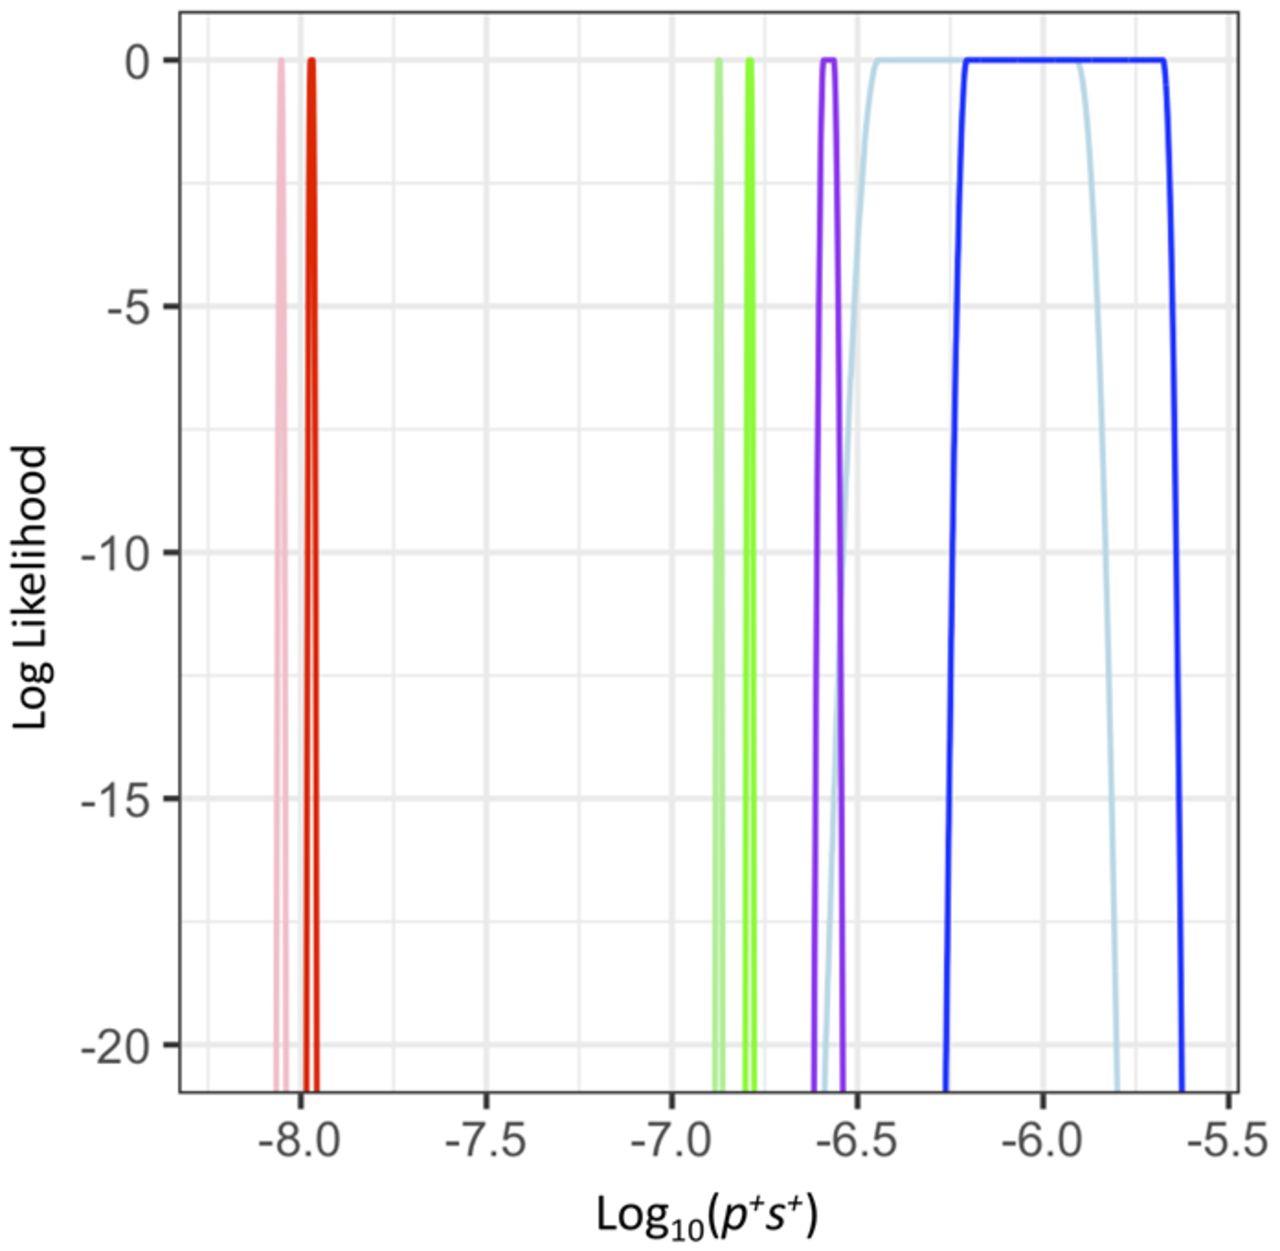
The composite parameter p+s+, capturing the proportion of beneficial mutations and the strength of selection, differs across species. LL curves for p+s+ in the three species. Red denotes the inference for D. melanogaster; green, the inference for mouse; blue, the inference for human using the chimpanzee as the outgroup; and purple, the inference for human using the macaque as the outgroup. Lighter colors denote the Simple model. Darker colors denote the Complex model, which better models the ancestral demography and population size of the outgroup. Note that regardless of which demographic model is used, the LL curves from the different species do not overlap within the top 500 LL units, suggesting p+s+ is significantly different among taxa.


