
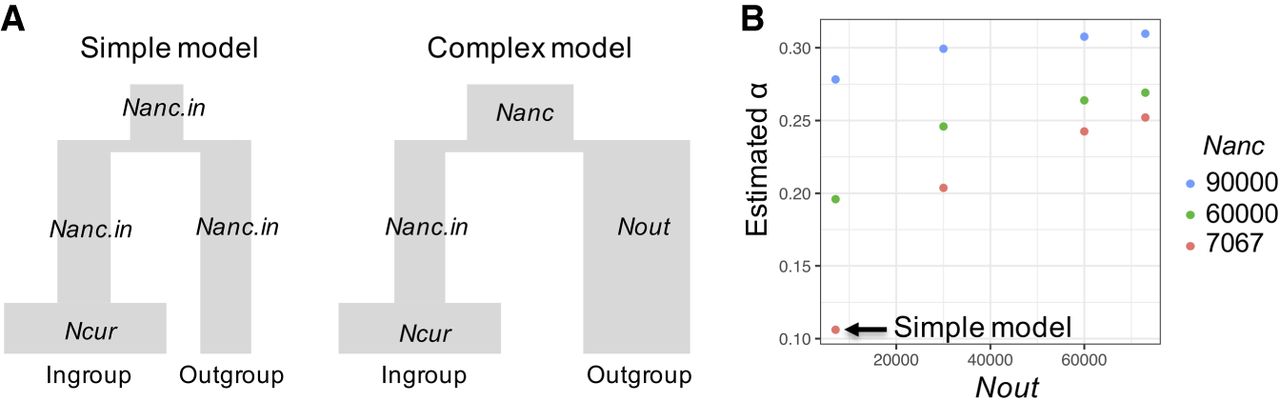
Figure 1.
The ancestral and outgroup population sizes greatly influence α. (A) Schematic demographic models illustrate the Simple and Complex models with associated parameters. In the Simple model, the size of the ancestral population (Nanc) and the size of the outgroup (Nout) are assumed to be the same as the ancestral size of the ingroup (Nanc.in). This assumption is relaxed in the Complex model. (B) Effect of Nanc and Nout on estimates of α for humans using the chimpanzee as an outgroup. Colors denote different values of Nanc. Arrow points to the estimate of α from the Simple model, where Nanc = Nout = Nanc.in = 7067.


