
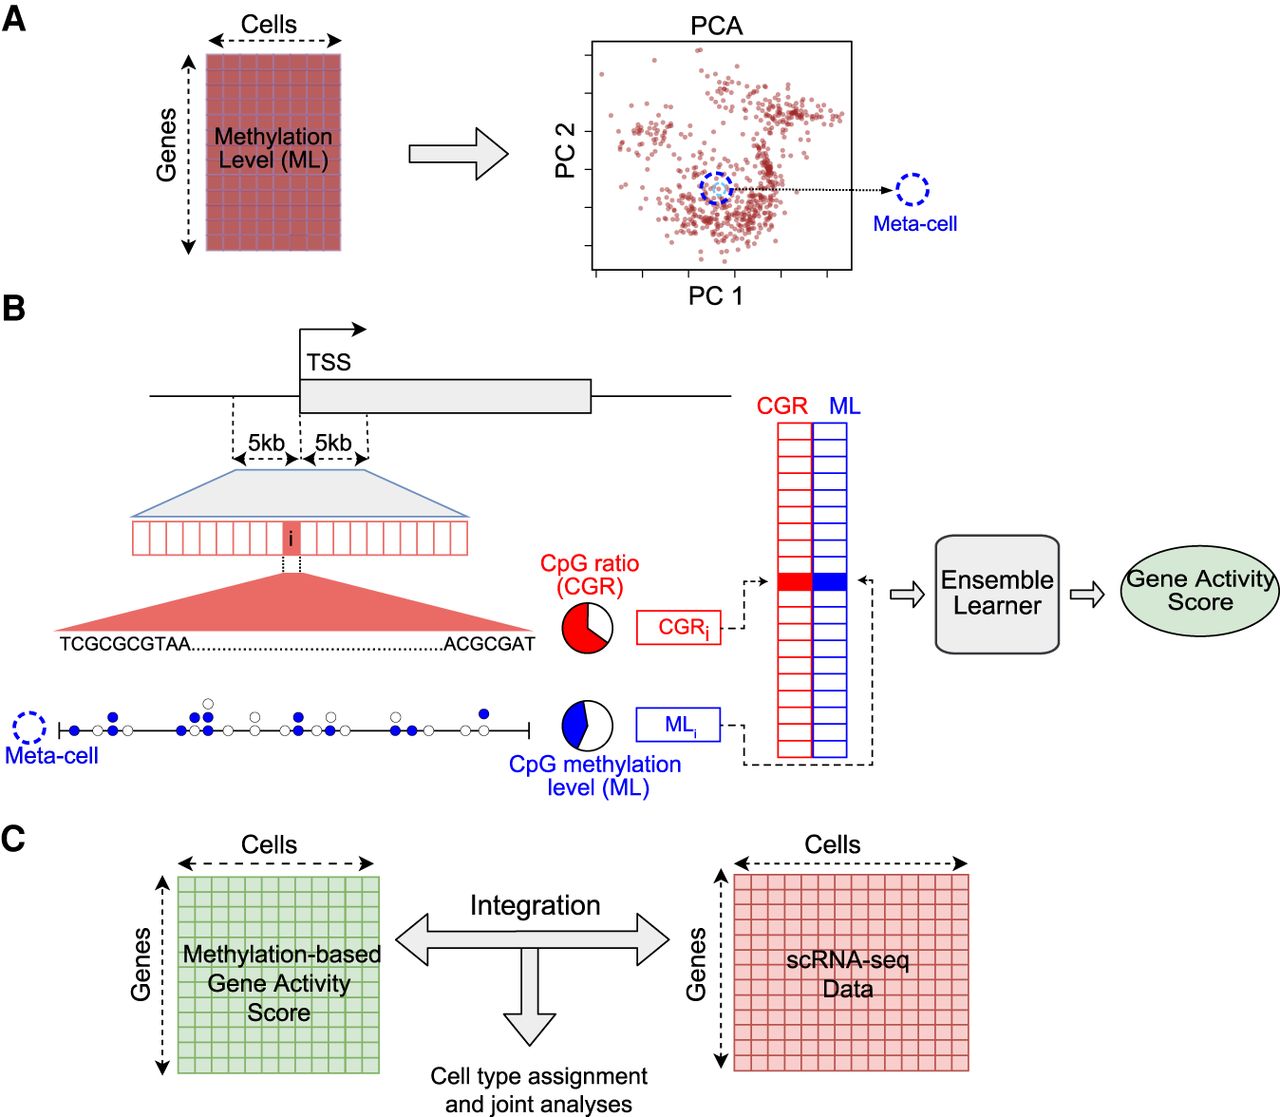
Schematic overview of the computational framework. (A) Generation of meta-cells from single-cell DNA methylation data. The gene-by-cell DNA methylation matrix is used for principal component analysis (PCA) to reduce the dimensionality. Each point in the PCA plot is a single cell. A meta-cell is the set of k-nearest cells to an individual cell in the PCA space. (B) Prediction of gene activity level by combining DNA methylation and sequence information in promoter. (TSS) Transcription start site; (ML) methylation level. Each horizontal box represents a genomic bin. Each circle represents a CpG site; a filled circle represents methylated cytosine, and an empty circle represents unmethylated cytosine in a meta-cell. CpG ratio is defined as the percentage of CpG dinucleotides in a genomic bin. CpG methylation level is defined as the ratio of the number of methylated CpG calls to all CpG calls. (C) Integration of single-cell methylation and single-cell RNA-seq data based on predicted gene activity scores using single-cell DNA methylation data.


