
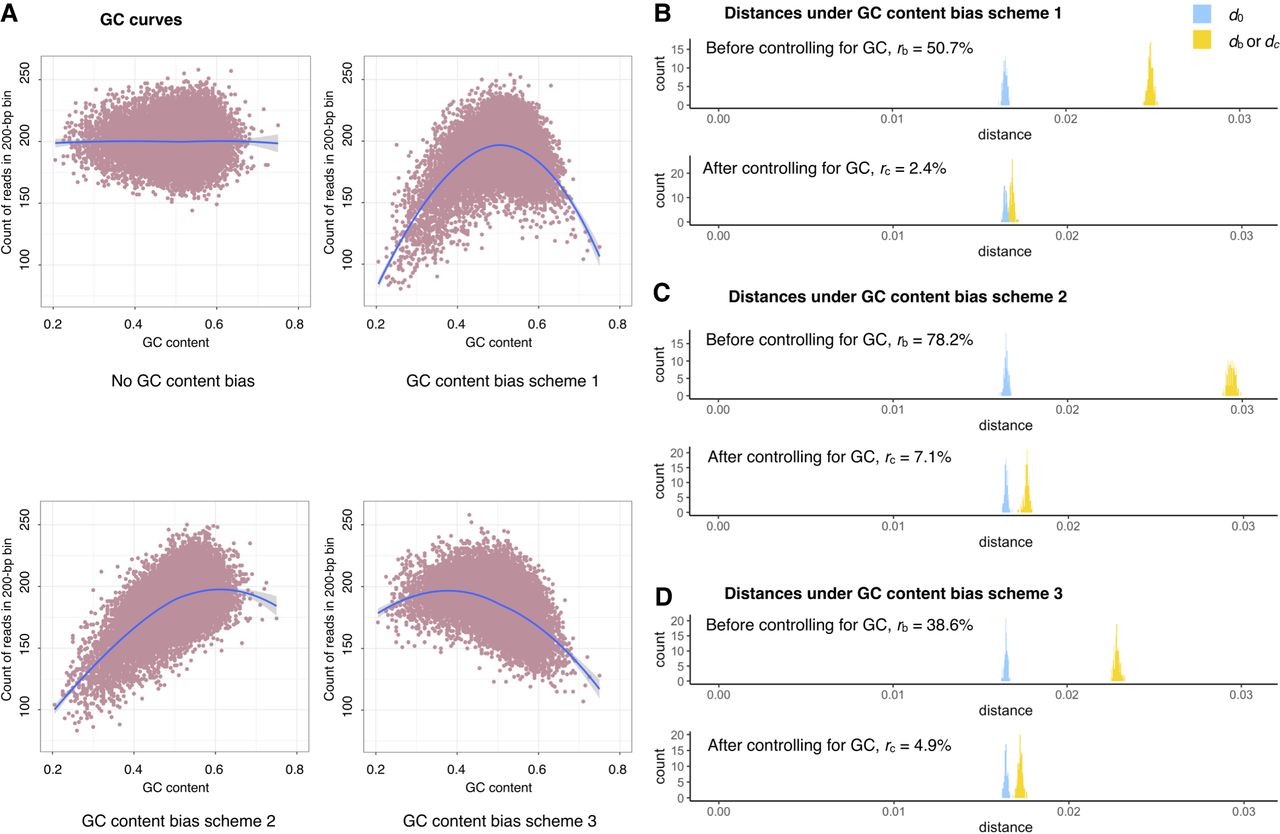
Figure 4.
The effect of controlling for GC content bias in Nubeam. (A) GC content (x-axis) versus bin coverage (y-axis) to demonstrate patterns of GC bias for three simulation schemes, with LOESS curve marked in blue. Recall that  and
and  measure relative differences before and after controlling for GC bias, respectively. (B) rc = 2.4% after controlling for GC bias versus rb = 50.7% before controlling for GC bias for simulation scheme 1. (C) rc = 7.1% after controlling for GC bias versus rb = 78.2% before controlling for GC bias for simulation scheme 2. (D) rc = 4.9% after controlling for GC bias versus rb = 38.6% before controlling for GC bias for simulation scheme 3.


