
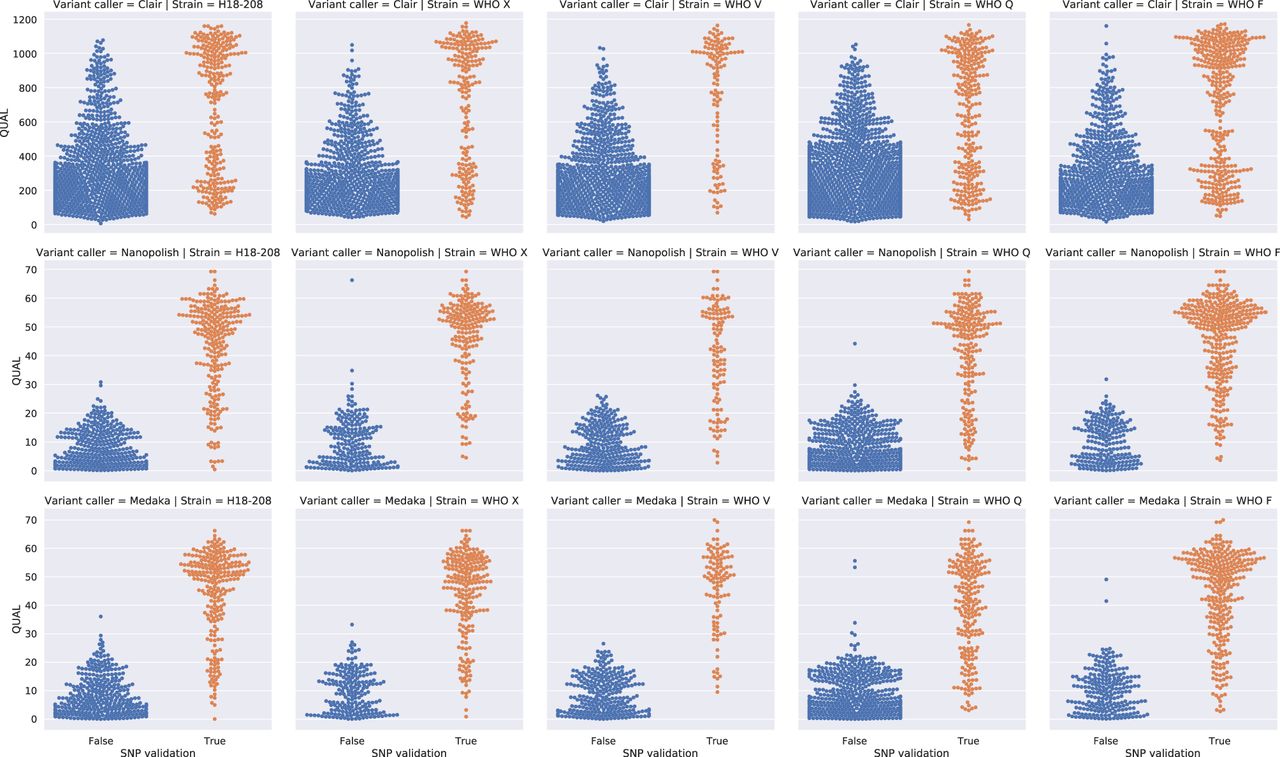
Figure 1.
Detection of SNPs using QUAL scores alone. Swarm plots of true (orange) and false SNPs (blue) detected by Clair (top), Nanopolish (middle), and Medaka (bottom). Each column is a different sequence. Each row has different y-axis values.


