
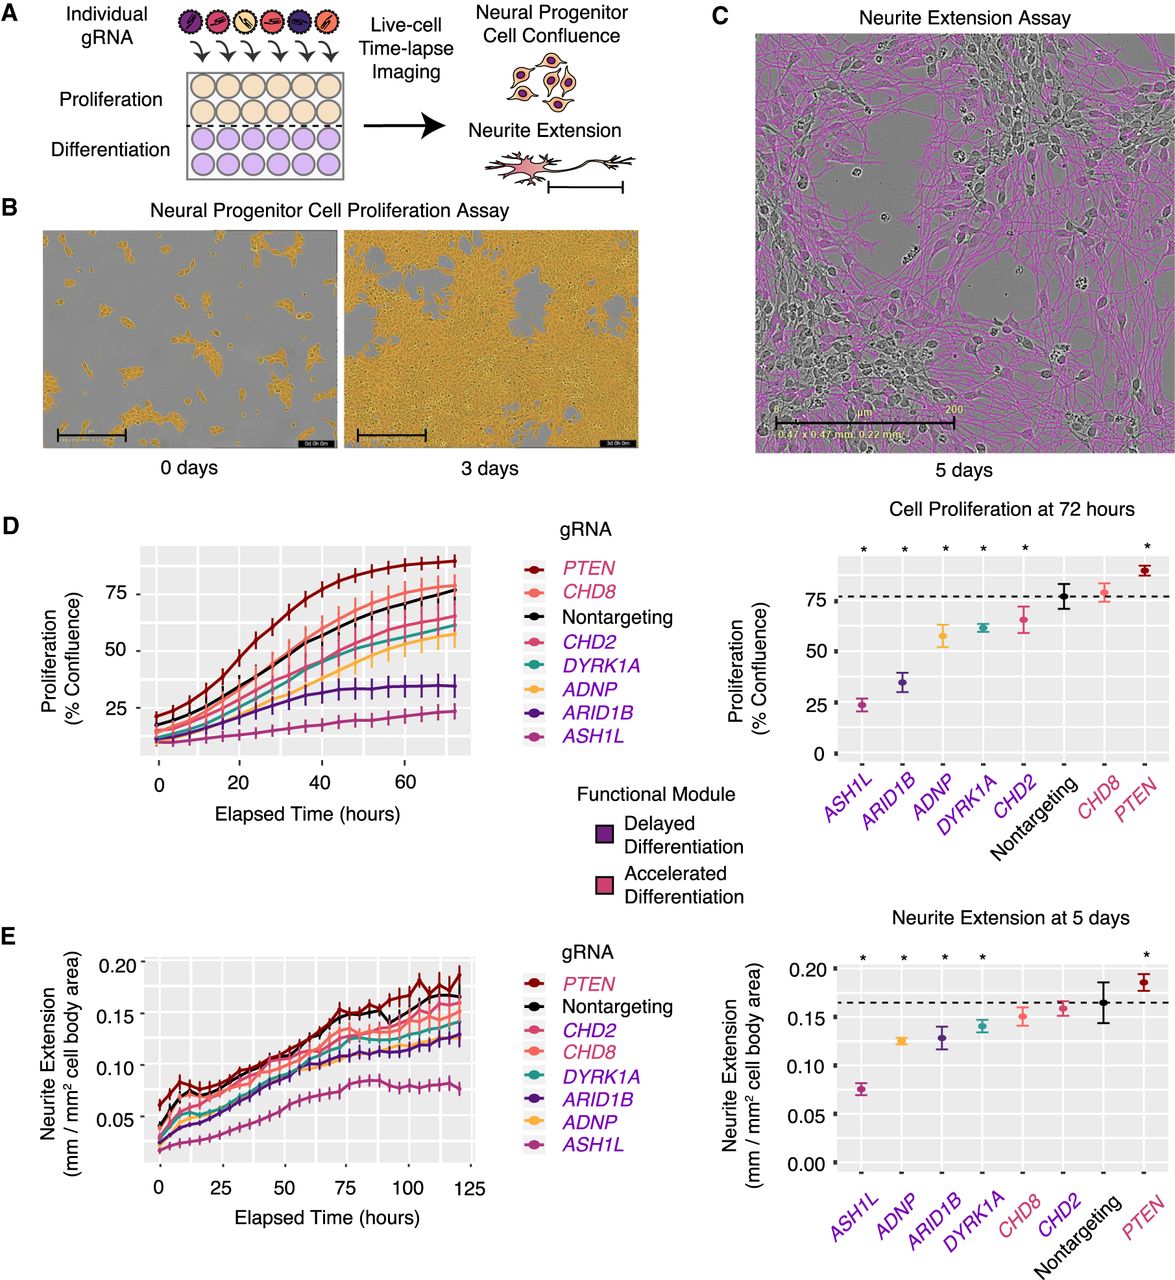
Live-cell imaging after repression of individual ASD genes confirms defects in cellular proliferation and neurite extension. (A) Schematic overview of arrayed gRNA screening. Cells infected with a single gRNA are assayed by time course imaging for confluence and neurite extension. (B) Representative images of neural progenitor cell proliferation assay at the start- and end-points (day 0 and day 3). Neural progenitor cell proliferation is measured by creating a cell mask (orange) and computing the area of confluence at each time point. (C) Representative image of neurite extension assay at 5 d postdifferentiation. Neurite extension is measured with the NeuroTrack assay in the IncuCyte software. Neurite masks are shown (purple). Neurite extension lengths are normalized by cell cluster area to account for any differences in cell number. Scale bars, 200 µm. (D) Time-lapse imaging of cellular proliferation (left), assessed by the percentage of confluence, reveals significant decreases or increases (right). (*) P < 0.01, t-test, dotted horizontal line indicates average in control cells. (E) Time-lapse imaging of neurite extension (left) and quantification (right). (*) P < 0.01, t-test, dotted horizontal line indicates average in control cells). All values in D and E represent mean ± SEM. Cells with each individual gRNA were plated in duplicate or triplicate wells for each experiment. Images were captured from nine fields per well at each time point. Experiments were repeated two to three times for all gRNAs.


