
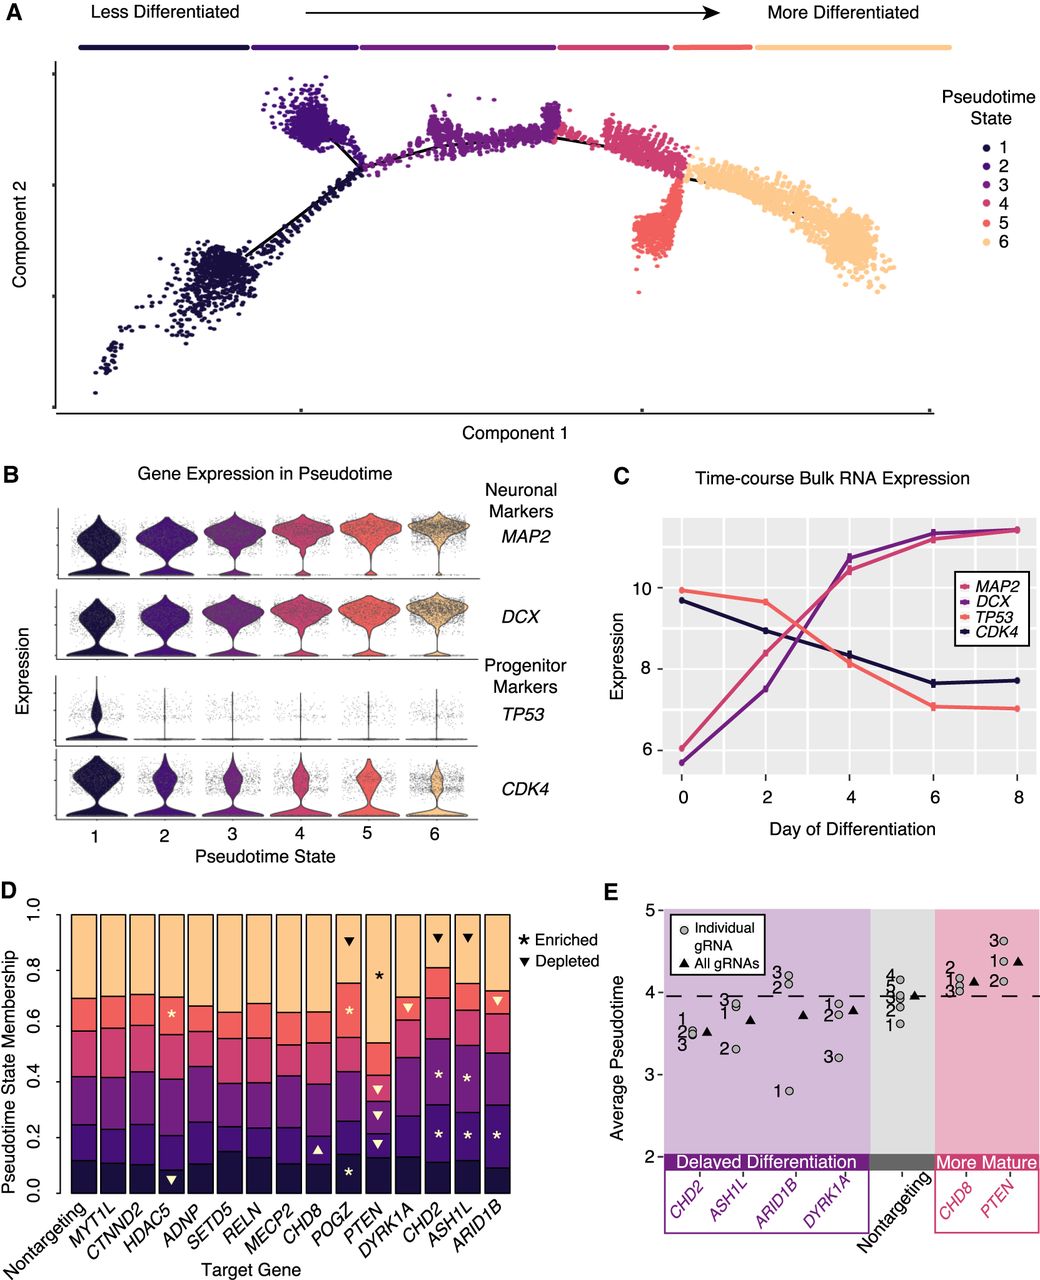
Pseudotime analysis reveals ASD-gene repression–induced alterations in differentiation trajectory and modules of ASD genes delaying or accelerating neuronal differentiation. (A) Pseudotime ordering of all single cells reveals a continuous trajectory of cell states corresponding to neuronal differentiation. Line segments along the trajectory are called “pseudotime states,” and cells are colored by these states. (B) Neuronal markers (MAP2 and DCX) increase along the pseudotime trajectory, whereas progenitor markers (TP53 and CDK4) decrease. (C) These marker genes show correlated patterns in time course bulk RNA expression. n = 2 replicates for each time point. Expression values, mean ± SEM. (D) Repression of some genes alter pseudotime state membership proportions. Significant enrichments and depletions are marked with asterisks and triangles, respectively (χ-squared test, P < 0.05). (E) Significantly decreased or increased average pseudotime scores relative to cells with nontargeting gRNAs (t-test, P < 0.01) indicate delayed or accelerated neuronal maturation. Boxed in purple is a set of ASD genes that delay neuronal differentiation by this metric. Boxed in red is a pair of genes, CHD8 and PTEN, that promote neuronal maturation. Overall (all gRNAs) and individual gRNA estimates of pseudotime are shown. Individual gRNAs numbers for each gene are indicated.


