
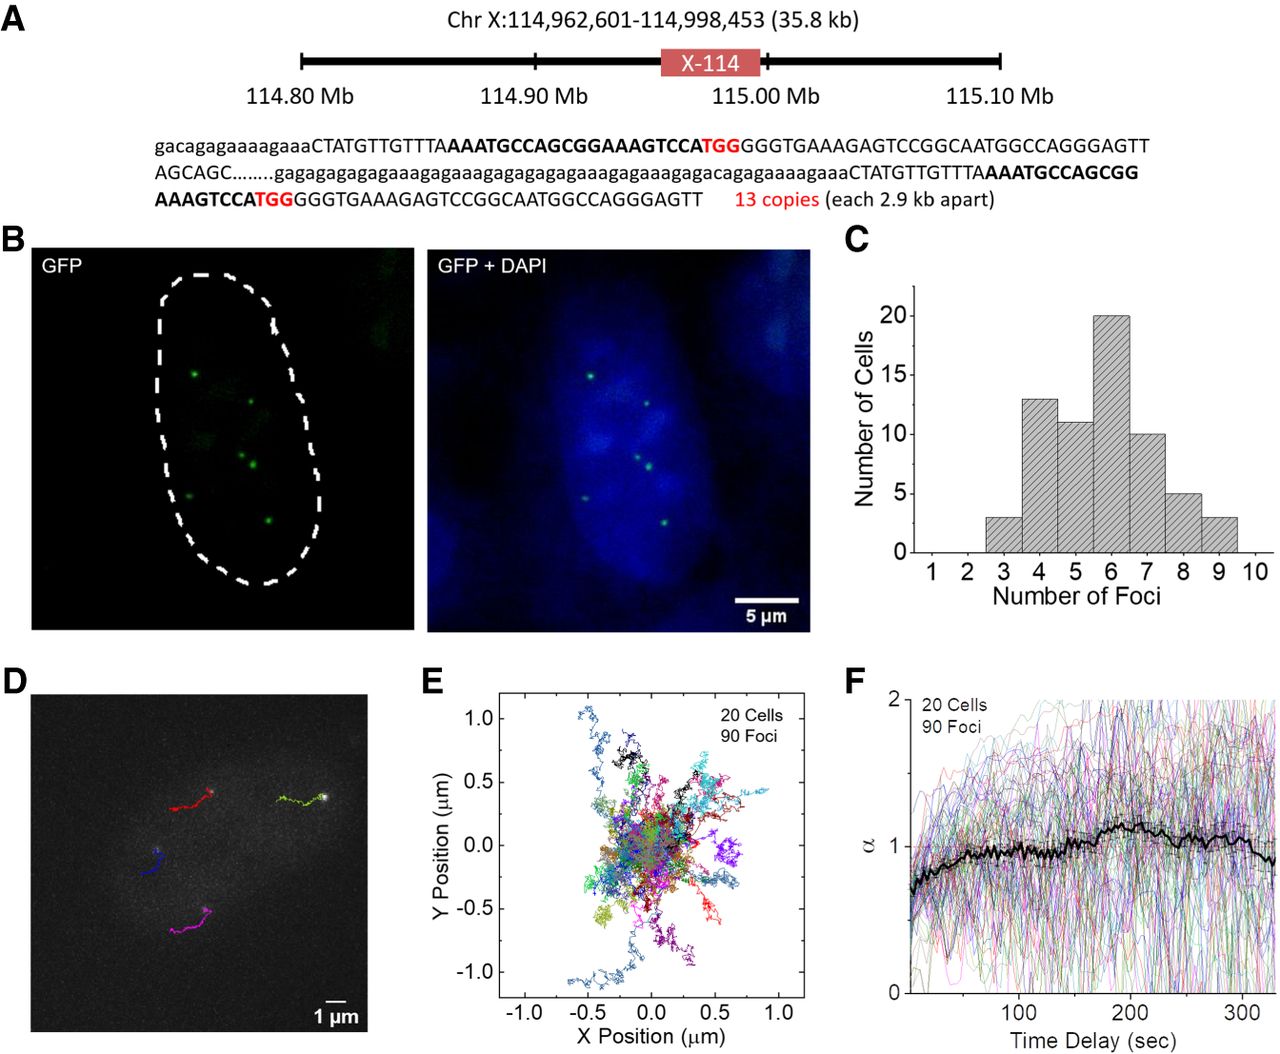
SunTag split-sfGFP CRISPR system allows imaging and tracking small-repeat loci. (A) Schematic diagram of the location of the X-114 loci in human Chromosome X shown with CRISPR target sequence (bold) and PAM (red). (B) A representative image of X-114 foci detected by the SunTag split-sfGFP system in fixed AD-293 cells, shown with the DAPI channel image. (C) Histogram of the number of X-114 foci automatically detected in each cell (n = 65 cells). (D) Exemplary trajectories of X-114 foci followed every 3 sec for 330 sec in a live AD-293 cell. (E) Collected trajectories of X-114 foci over 330 sec (n = 90). (F) Diffusion exponent α from MSD curves of the trajectories in E, calculated for varying time delays. Trajectories longer than 450 sec were used for this analysis. Average and SEM are shown as a black curve.


