
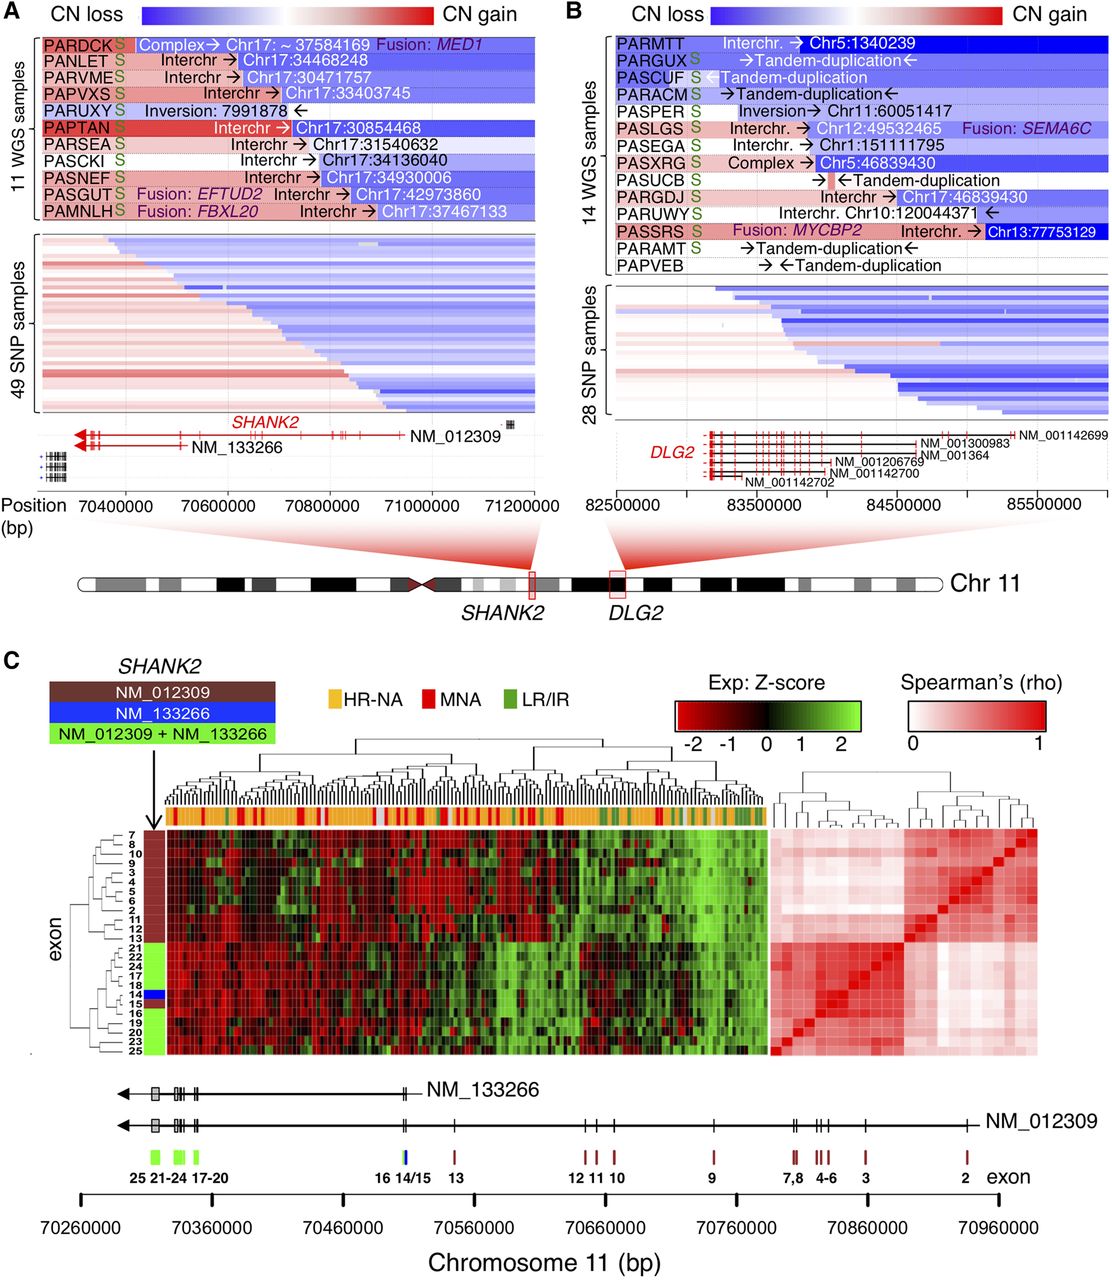
Neuronal genes SHANK2 and DLG2 are frequently disrupted by translocation events involving Chr 11. (A,B) Copy number, junction location, and opposite break end destination location and types of SVs at genomic regions harboring rearrangements that span SHANK2 (A) and DLG2 loci (B); “S” at the left of the panel indicates positive validation by Sanger sequencing for SHANK2 (Supplemental Fig. S17) and DLG2 (Supplemental Fig. S18). Associated gene fusion events obtained from RNA-seq are also indicated in purple text. The top panel contains information derived from WGS, whereas the lower panel derives from SNP arrays and only represents CNV information. (C) Clustering analysis of SHANK2 exon level FPKM from RNA-seq data. The heatmap (left) shows higher exon expression level in low/intermediate risk compared to MNA and HR-NA samples. The correlation matrix (right) shows two well-defined clusters associated with the two known coding isoforms of the gene. Exons are color coded according to their isoform involvement.


