
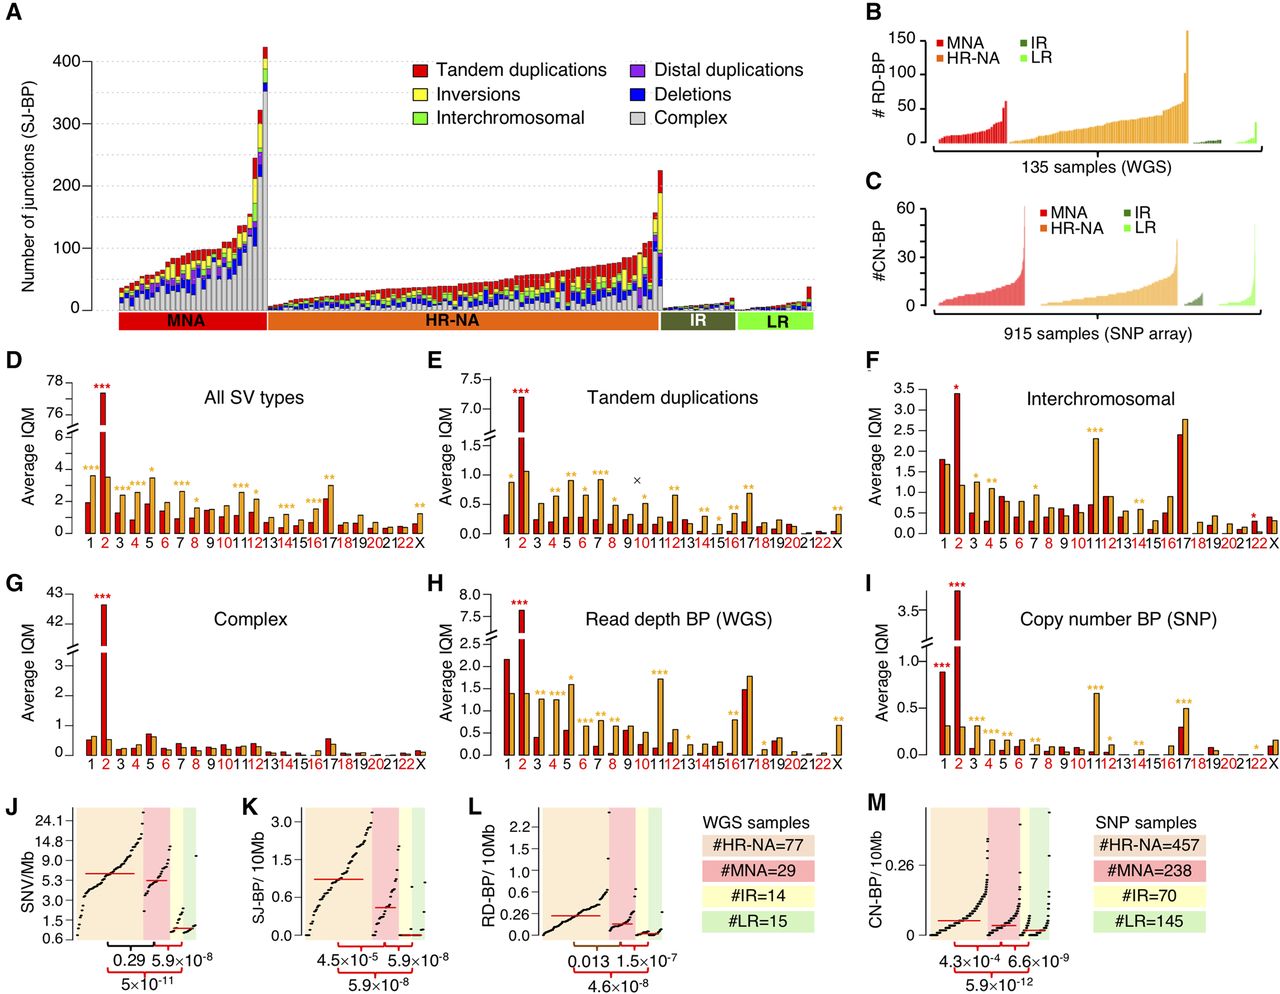
Somatic structural variation burden differs among neuroblastoma subtypes by quantity, type, and genomic location. (A) Stacked bar chart of alignment-based SV calls by type and neuroblastoma subtype in WGS data set. (B) Bar plot representing the number of read-depth breakpoints (RD-BP) per sample across subtypes in the WGS data set. (C) Bar plot representing the number of copy number breakpoints (CN-BP) per sample across subtypes in the SNP data set. (D–I) By-chromosome comparison between MNA and HR-NA of the interquantile average number of SVs including all SJ-BP variant types (D), tandem duplications (E), inter-chromosomal translocations (F), complex events (G), as well as CNV breakpoints as defined by RD-BP (H) and CN-BP (I). A Wilcoxon test is obtained for every chromosome, and the P-value significance level is represented as follows: (***) P < 0.001; (**) P < 0.01; (*) P < 0.05. Asterisk color indicates the group with higher IQM: (red) MNA; (orange) HR-NA. Mutation burden analysis plot across neuroblastoma subtypes representing the burden of SNVs (J), SJ-BPs (K), RD-BPs (L), and CN-BP (M).


