
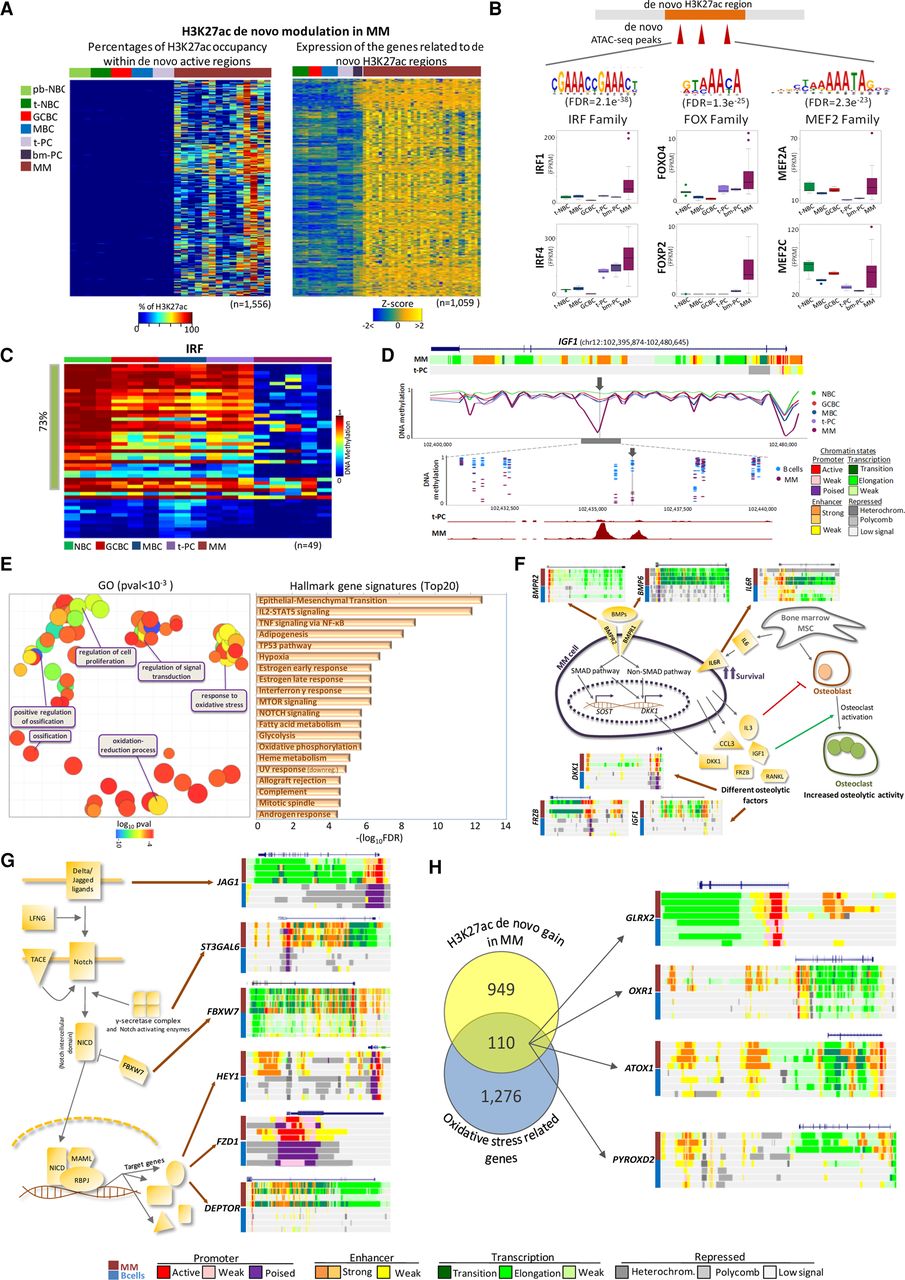
Functional impact of de novo chromatin activation in MM. (A) Heat maps representing the percentage of the regions covered by H3K27ac peak within the de novo activated regions in MM (left panel) and expression of the genes associated with these regions. (B) TF families motifs enriched in the de novo activated regions in MM, that is, IRF, FOX, and MEF2, as identified by MEME analysis. For each TF family, expression of two selected members up-regulated in MM as compared to normal B cells is shown. (C) Heat map representing methylation levels of all CpGs (n = 49) identified within IRF motifs, in different subpopulations of normal B cells and MM samples. Green bar at left marks the CpGs hypomethylated in MM. (D) Example of DNA methylation profiles within IGF1 gene. Upper panel shows a global view of a whole gene, with chromatin state track of MM and t-PC, while the lower panels represent the zoom to the IRF motif locus. Gray arrow shows CpG within IRF motif. (E) Gene Ontology results, shown as semantic-similarity scatterplot of the most significant GO terms (P < 0.001), summarized together by REVIGO software (left panel) and a list of top 20 hallmark gene signatures, determined using MSigDB Collection (right panel). (F) Schematic representation of mechanisms involved in interactions between MM and the bone marrow microenvironment, with selected genes harboring activated chromatin in MM as compared to normal B cells. (G) Schematic representation of the NOTCH signaling pathway with selected genes harboring activated chromatin in MM as compared to normal B cells. (H) Venn diagram presenting the overlap of genes associated with de novo active regions in MM and genes belonging to GOs related with oxidative stress (i.e., oxidative-reduction process and response to oxidative stress). Chromatin states within selected genes in MM and normal B cells are shown on the right panel. (bm-PC) Plasma cell from bone marrow.


