
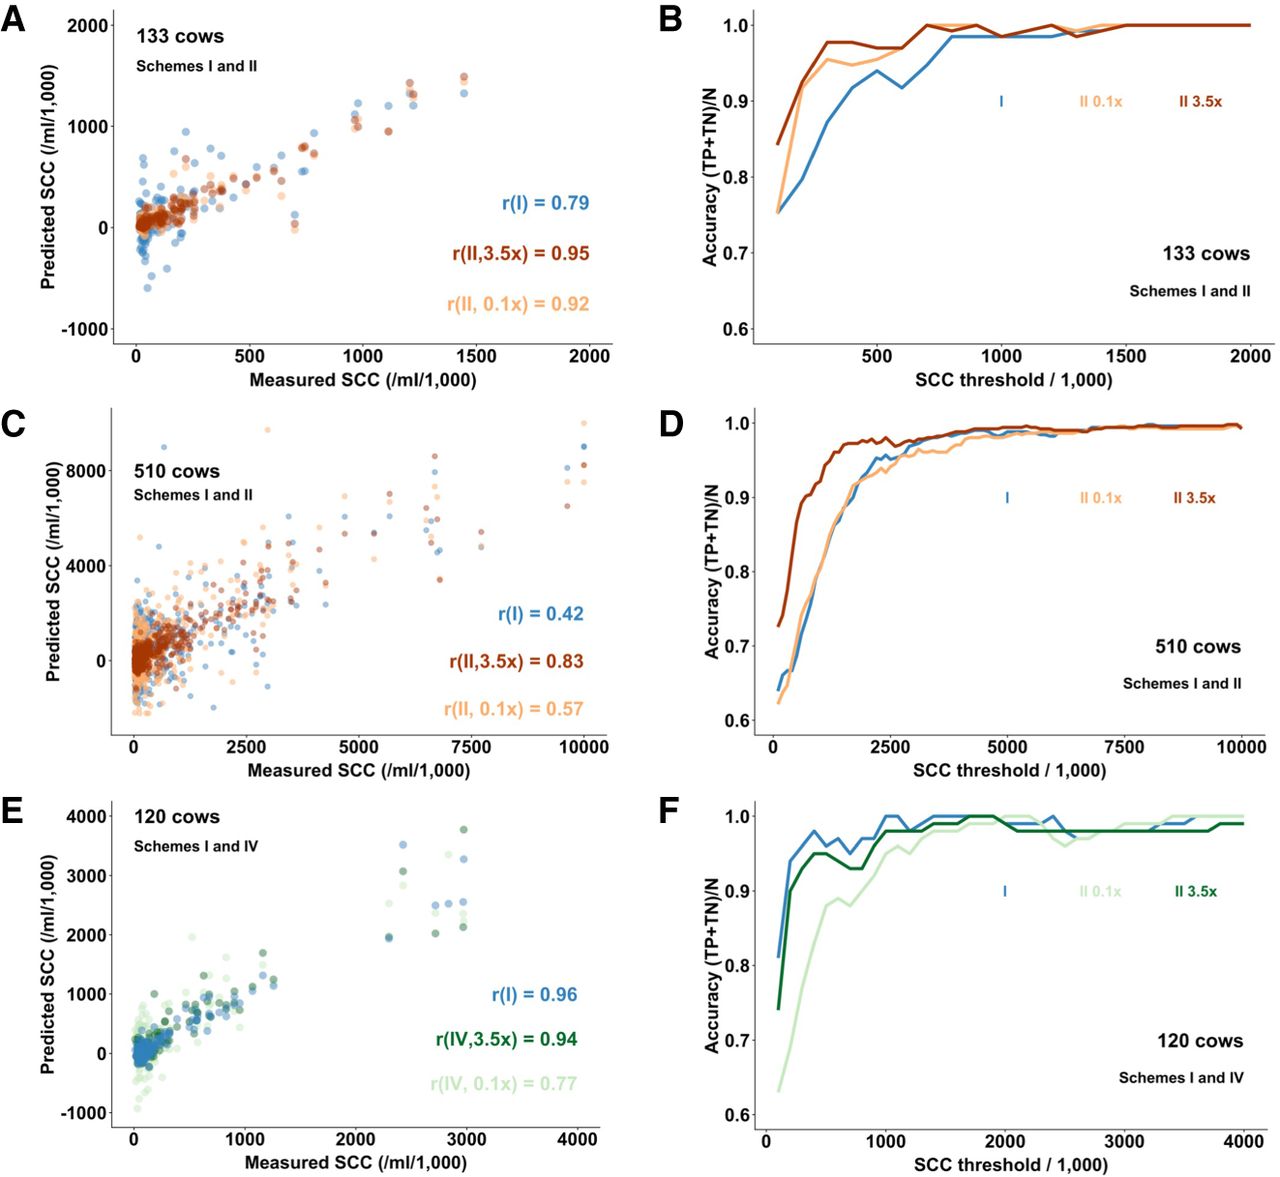
Figure 3.
Correlation between predicted and measured SCCs in the milk of individual cows (A,C,E), as well as accuracies in classifying cows with SCCs above and below a chosen threshold value (B,D,F), in farms with 133 (A,B), 520 (C,D), and 120 (E,F) cows, using scheme I (blue), scheme II (red), or scheme IV (green). (Scheme I) Cows and tank milk genotyped with LD SNP arrays (17 K), no imputation. (Scheme II) Cows genotyped with LD array and imputed to 13 M SNPs; tank milk sequenced 3.5× (red) or 0.1× (orange). (Scheme IV) Cows genotyped by WGS (1×) and imputation to HD; tank milk sequenced at 3.5× (dark green) or 0.1× (light green).


