
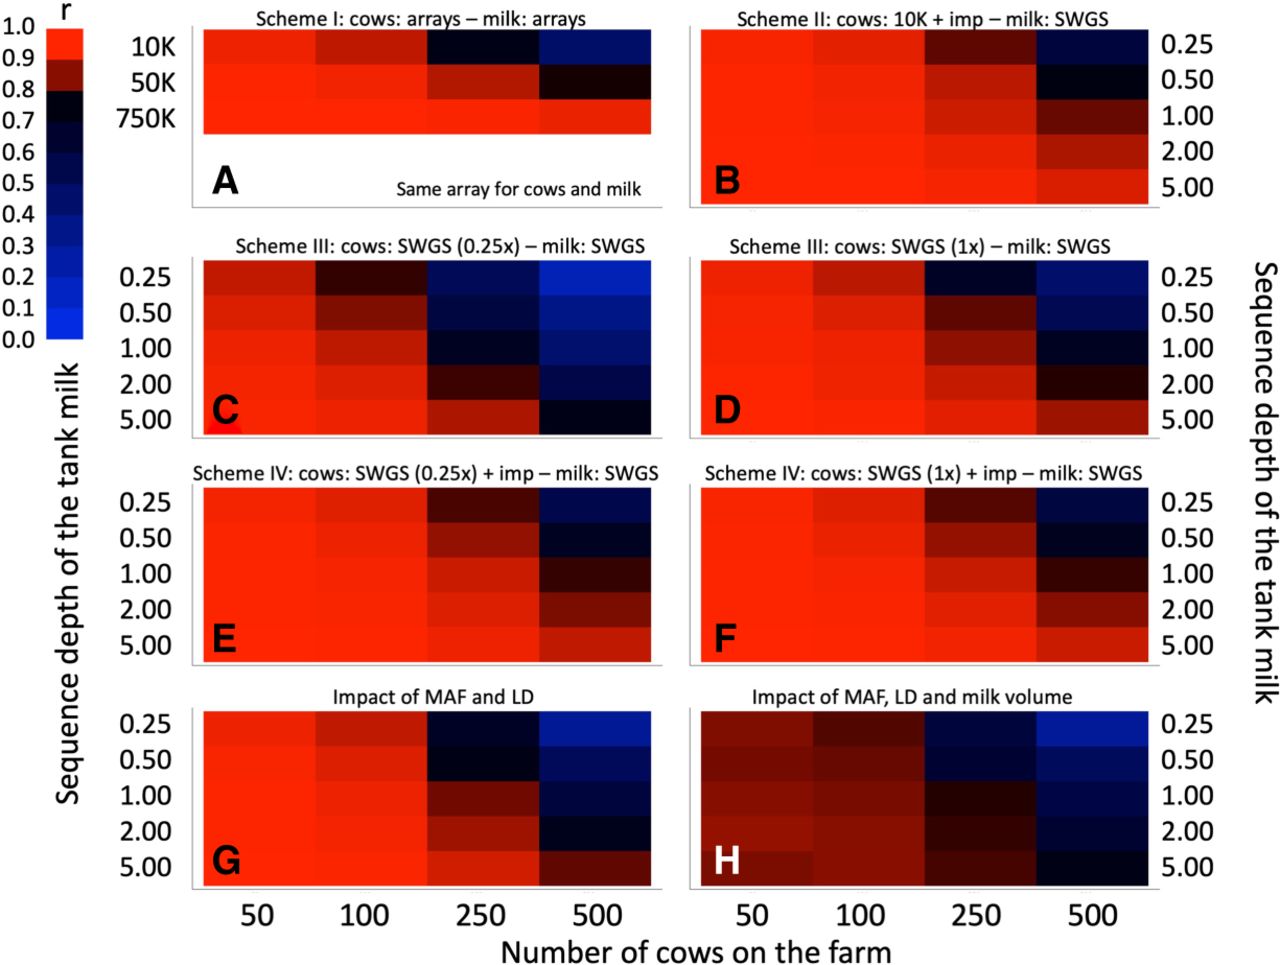
Evaluating the efficiency of the proposed approach by simulation. (A) Reference scheme I in which individual cows and tank milk are genotyped with the same array interrogating 10,000 (LD), 50,000 (MD), or 700,000 (HD) SNPs. (B) Scheme II in which individual cows are genotyped with a LD 10,000 SNP array and imputed to whole genome (8 M SNPs), whereas the tank milk is whole-genome sequenced at depth ranging from 0.25× to 5×. (C) Scheme III in which individual cows (0.25×) and tank milk (range: 0.25× to 5×) are genotyped by SWGS. (D) Same as C except that individual cows are sequenced at 1× depth. (E) Scheme IV in which individual cows are genotyped by SWGS (0.25×) followed by imputation to whole genome (8 M SNPs), and tank milk is genotyped by SWGS (range: 0.25× to 5×). (F) Same as E except that individual cows are sequenced at 1× depth. (G) Scheme in which the cow genotypes are sampled from a real data set and hence conform to reality with regard to distribution of MAF, LD, and relatedness. Genotypes of the cows are assumed to be known (very similar to II and IV) and tank milk genotyped by SWGS (range: 0.25× to 5×). (H) Same as G except that the milk volume is estimated with error. The color code used to quantify the correlations between predicted and real SCCs is shown. Corresponding numerical values are provided in Supplemental Table 1.


