
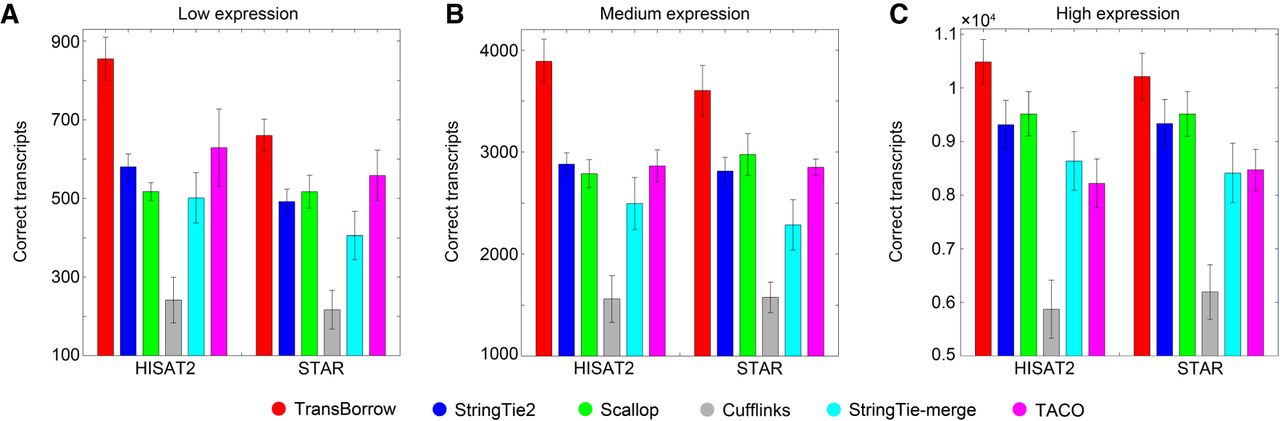
Figure 5.
Performance comparisons of the assemblers in identifying transcripts with different expression levels on the real data. (A–C) The average number of correctly assembled transcripts with different expression levels by the assemblers on data sets R1, R2, R3, and R4.


