
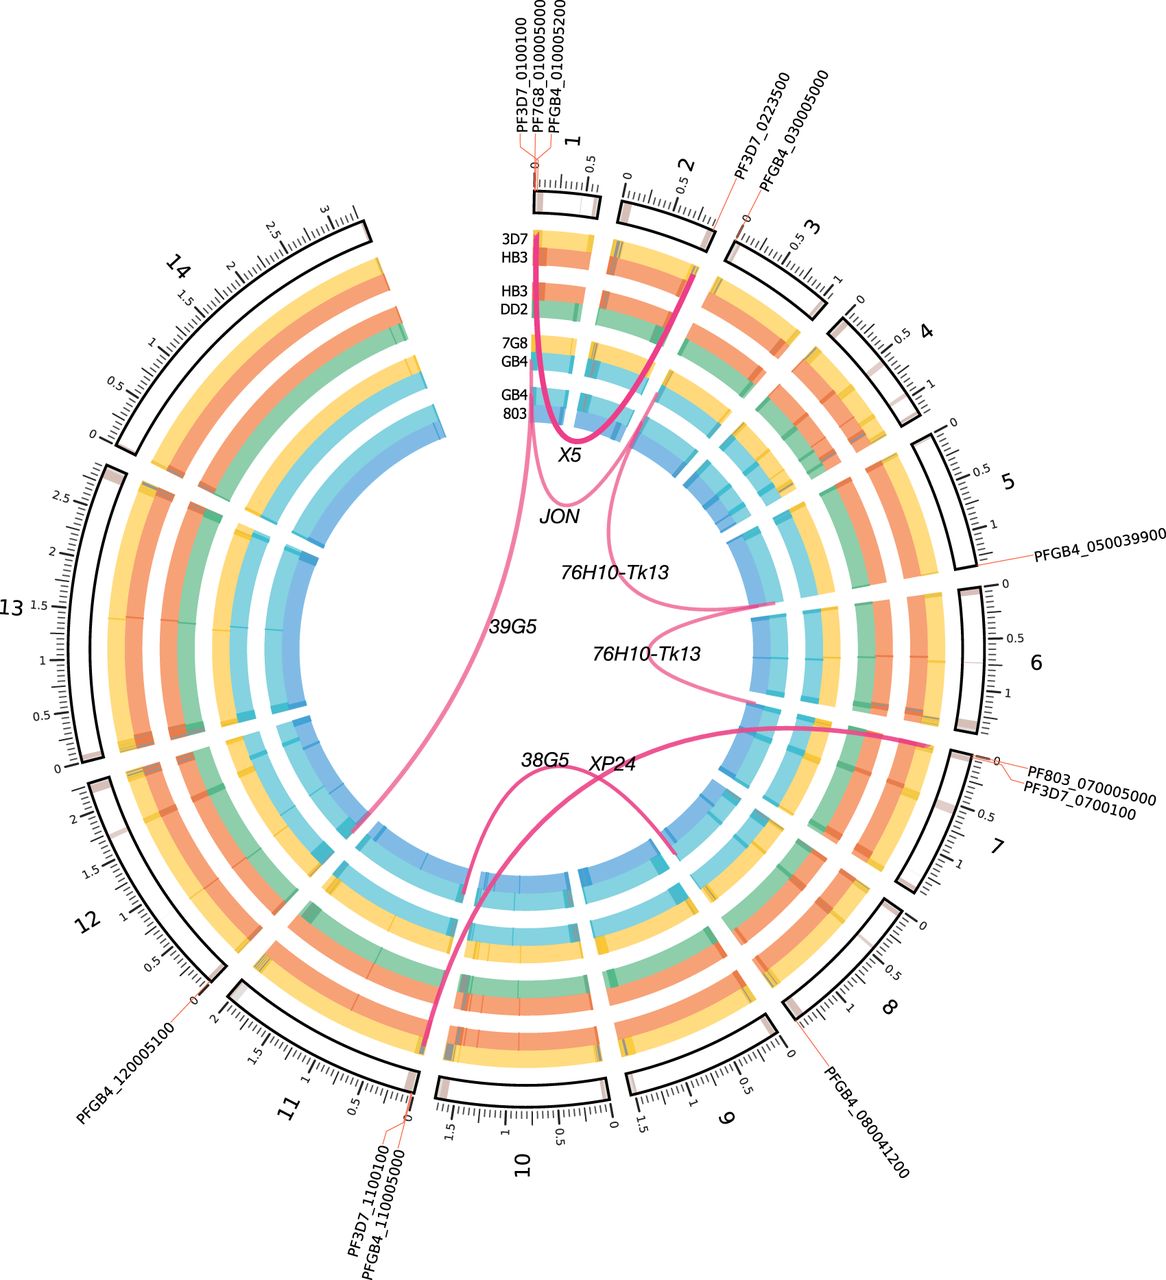
Figure 5.
Circos (Krzywinski et al. 2009) plot of NAHR events detected in all 119 samples across four P. falciparum experimental crosses. Parental genomes for each cross are depicted in the inner grouped circular tracks. Bézier curves depict each translocation event, with termini indicating the parent(s) of origin and a label at the apex of the curve identifying the sample in which it was found. Closest gene names annotated on outer circumference. Dark bands indicate noncore regions determined by the Spine (Ozer et al. 2014) software, except in the outer ideogram, which is based on alignability maps for the canonical 3D7 reference genome (Miles et al. 2016).


