
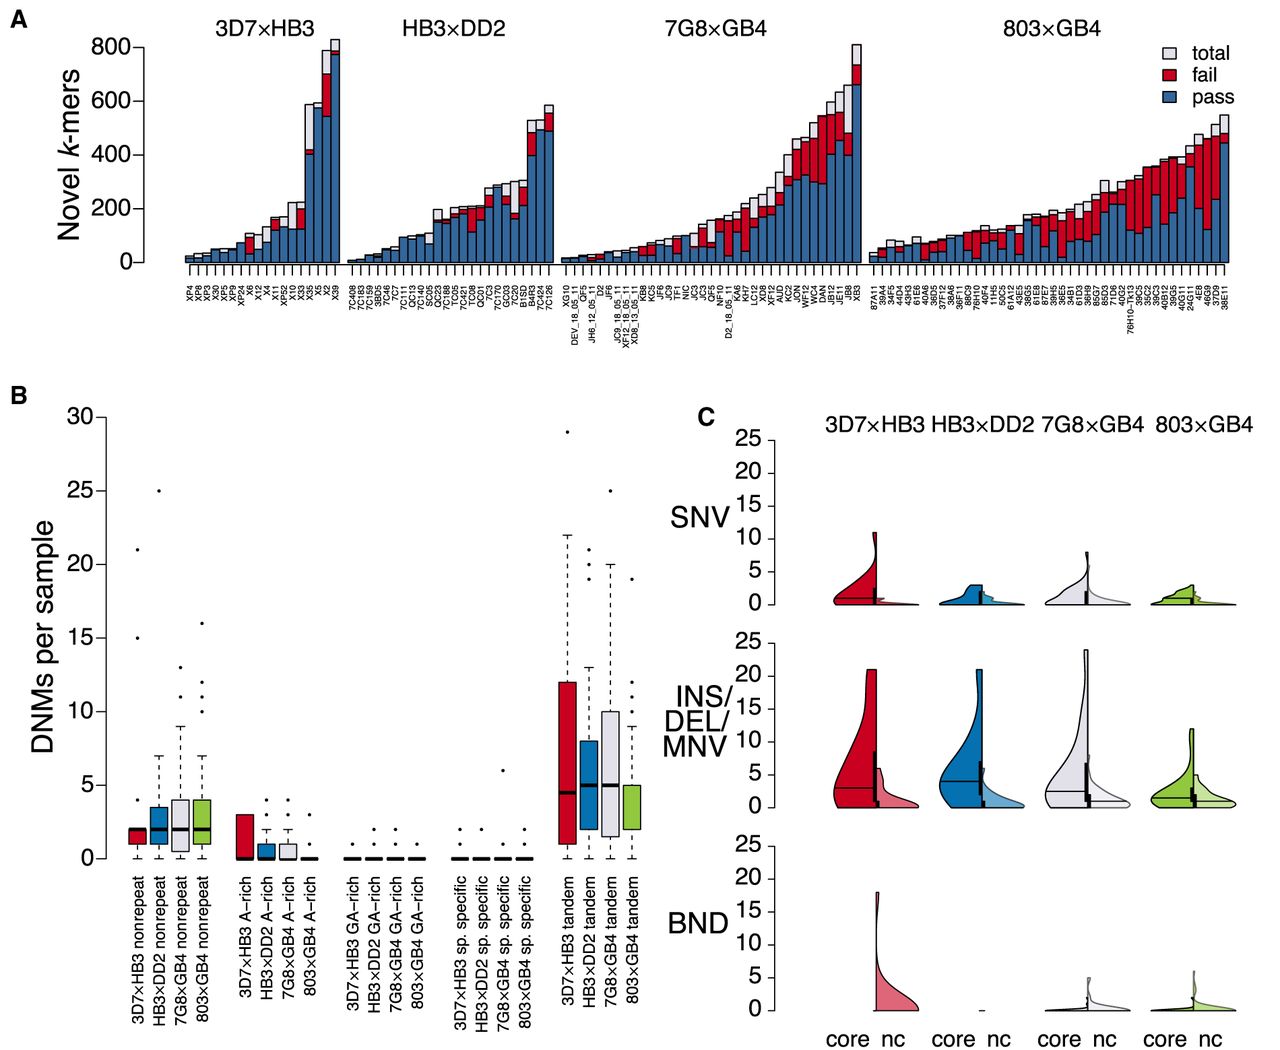
Figure 4.
Per-sample DNM discovery metrics in 119 P. falciparum progeny. (A) Novel k-mers per cross and sample (gray bars). For those contained within successfully assembled variants, k-mers in variant passing filters are shown in green; the rest are shown in red. (B) Per-cross DNM sample distributions for mutations appearing in repetitive regions of the respective parental genomes. (C) Violin plots showing DNM sample distributions per cross, split by those in core genomic regions (left) and noncore regions (right).


