
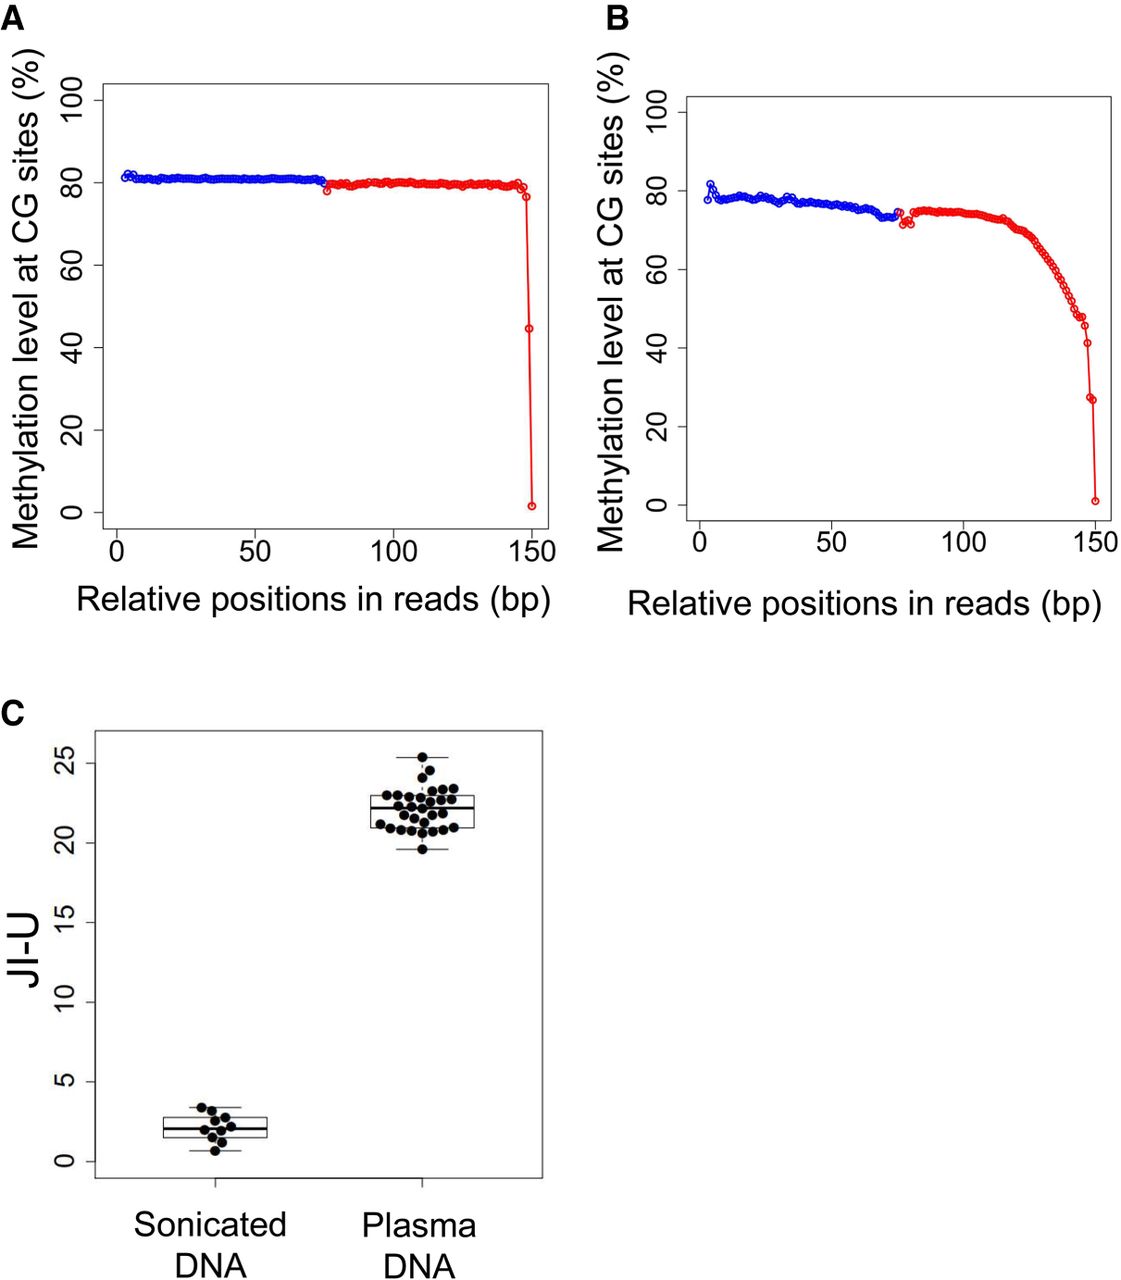
Presence of jagged ends in sonicated DNA and plasma DNA. (A) Methylation levels in white blood cell DNA across different CG sites in read1 and read2 after pooling all aligned paired-end reads. The blue dots represent the pooled methylation signal contributed by sequenced CGs at the relative positions in read1. The red dots represent the pooled methylation signal at the relative positions in read2. The methylation signal was calculated by the percentage of sequenced CGs with respect to the total sequenced CGs and TGs. (B) Methylation levels in white blood cell DNA across different CG sites in read1 and read2 after pooling all aligned paired-end reads. (C) JI-U between sonicated DNA and plasma DNA samples. The JI-U represents the jagged index deduced from unmethylated signals at CG sites.


