
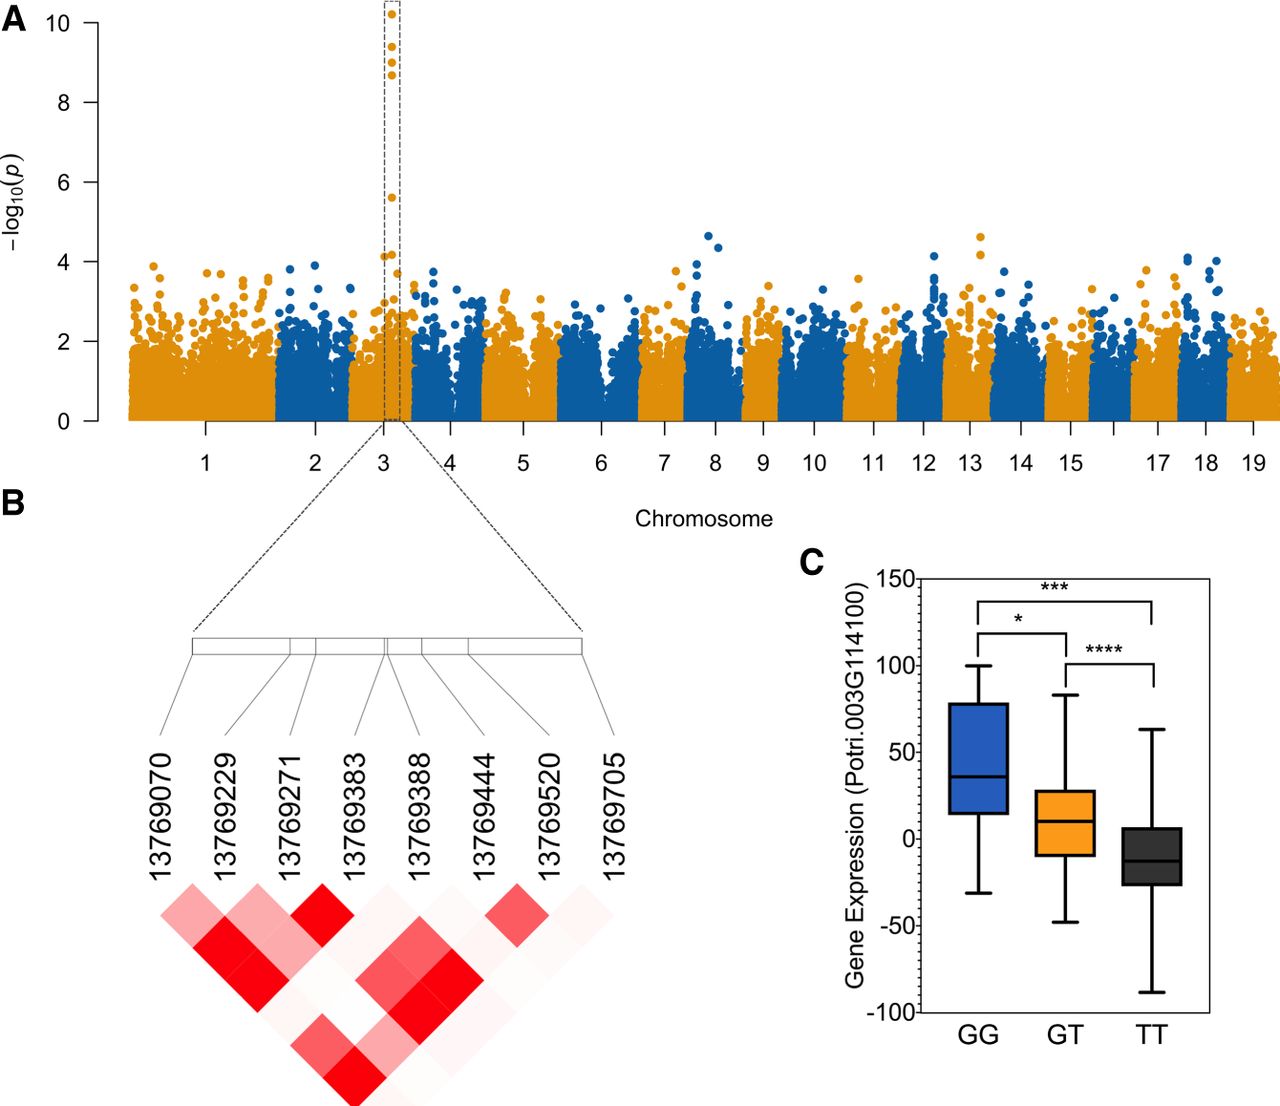
Local SNPs regulate the expression of MYB125. (A) Manhattan plot displaying the eQTL results for MYB125. The significant SNPs associated with the expression of MYB125 are located within the coding and UTR sequences of MYB125. The x-axis shows the chromosome positions, and the y-axis shows the significance expressed as –log10. (B) Pattern of linkage disequilibrium in the region of MYB125 across the SNPs with significant association. Darker red indicates stronger correlation. (C) Boxplot for expression of MYB125 plotted as an effect of genotypes at the SNP with the smallest P-value for the eQTL association (for boxplot for expression of MYB125 plotted as an effect of genotypes of the other SNPs, see Supplemental Fig. S8). The horizontal line represents the median, and the vertical lines mark the range of the minimum and maximum values. Data were analyzed using ANOVA followed by Tukey's multiple comparison test. Significance is indicated by asterisks: (****) P-value < 0.0001; (***) P-value < 0.001; (*) P-value < 0.05.


