
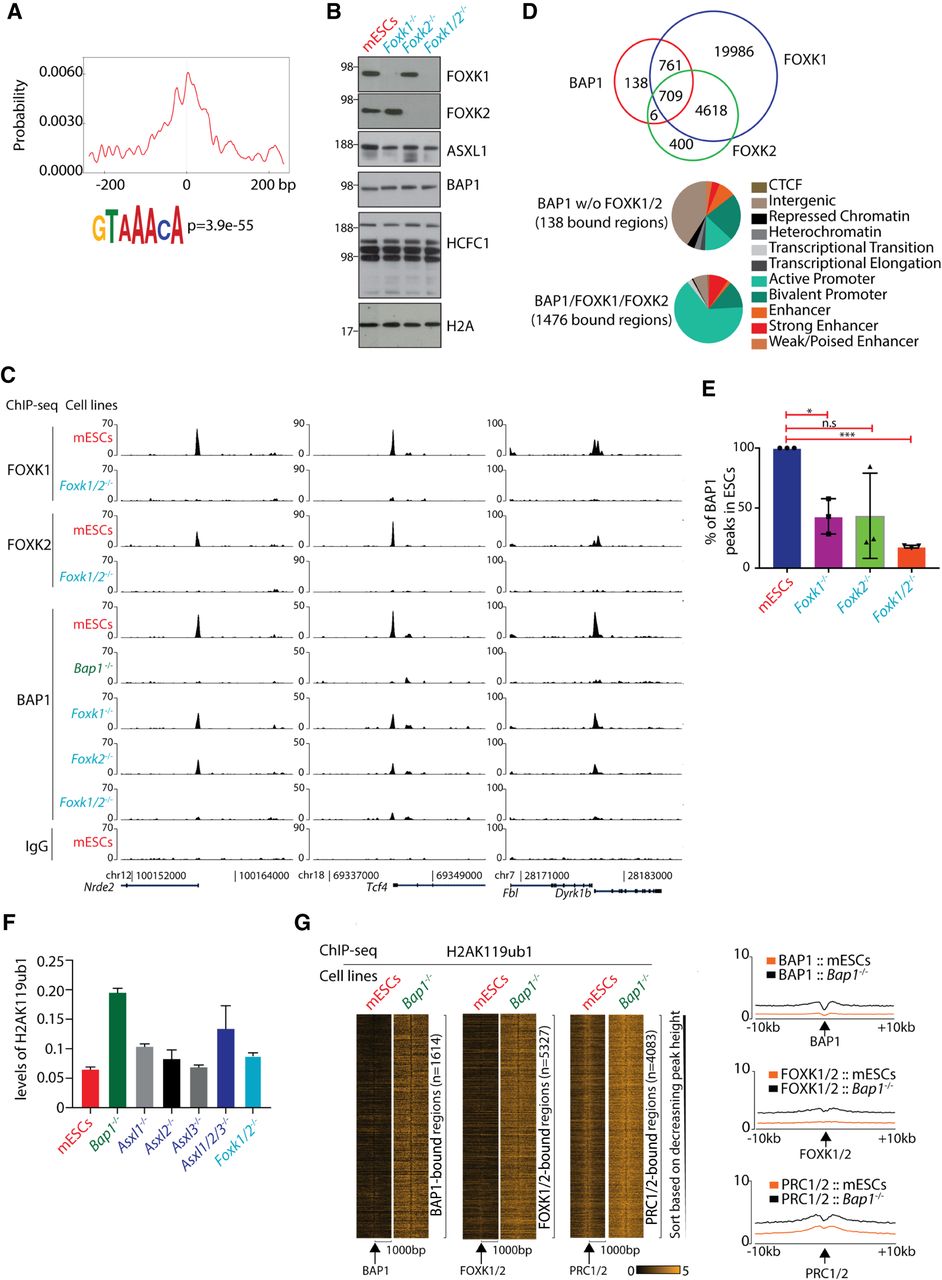
Site-specific binding of BAP1 to chromatin is dependent on FOXK1 and FOXK2. (A) Motif analysis of the top 5000 3×FLAG-Bap1 binding regions revealed an enrichment for the FOX motifs centralized around the BAP1 peaks. (B) Western blots demonstrating the expression levels of FOXK1, FOXK2, ASXL1, BAP1, HCFC1, and H2AK119ub1 in wild-type mESCs, Foxk1−/−, Foxk2−/−, and Foxk1/2−/− mESCs. (C) ChIP-seq screenshot for three representative loci showing the binding of FOXK1 and FOXK2 in wild-type and Foxk1/2−/− mESCs and BAP1 in wild-type mESCs, Bap1−/−, Foxk1−/−, Foxk2−/−, and Foxk1/2−/− mESCs. (D) Euler diagrams showing the overlap between BAP1, FOXK1, and FOXK2 peaks, in wild-type mESCs showing that 1476 BAP1 regions colocalize with FOXK1/2 (top panel). Hidden Markov analysis for the 138 BAP1-bound not overlapping with FOXK1/2 binding in mESCs and the 1476 BAP1/FOXK1/FOXK2-bound regions and the organization of these regions into the 11 indicated categories (bottom panel). Based on hypergeometric test, the overlap between BAP1 and FOXK1 (P-value < 1.89 × −7) and the overlap between BAP1 and FOXK2 (P-value < 3.248 × −264) are statistically significant. (E) Identification of the (percentage) BAP1 peaks remaining in Foxk1−/−, Foxk2−/−, and Foxk1/2−/− mESCs compared to wild-type mESCs. Unpaired t-test with Welch correction. (*) P-value = 0.0215; (***) P-value < 0.0001. (F) The relative H2AK119ub1 levels in wild-type mESCs, Bap1−/−, Asxl1−/−, Asxl2−/−, Asxl3−/−, Asxl1/2/3−/−, and Foxk1/2−/− mESCs, as determined by mass spectrometry. (G) Heat maps illustrating enrichments of H2AK119ub1 in 2 kb around the BAP1, FOXK1/2, and PRC1/2 peaks in wild-type and Bap1−/− mESCs. The H2AK119ub1 ChIP-seqs were performed in triplicate and the first replicate is depicted. In the right panel, the average profiles of the H2AK119ub1 ChIP-seq signals in 20 kb around the BAP1, FOXK1/2, and PRC1/2 peaks are depicted.


