
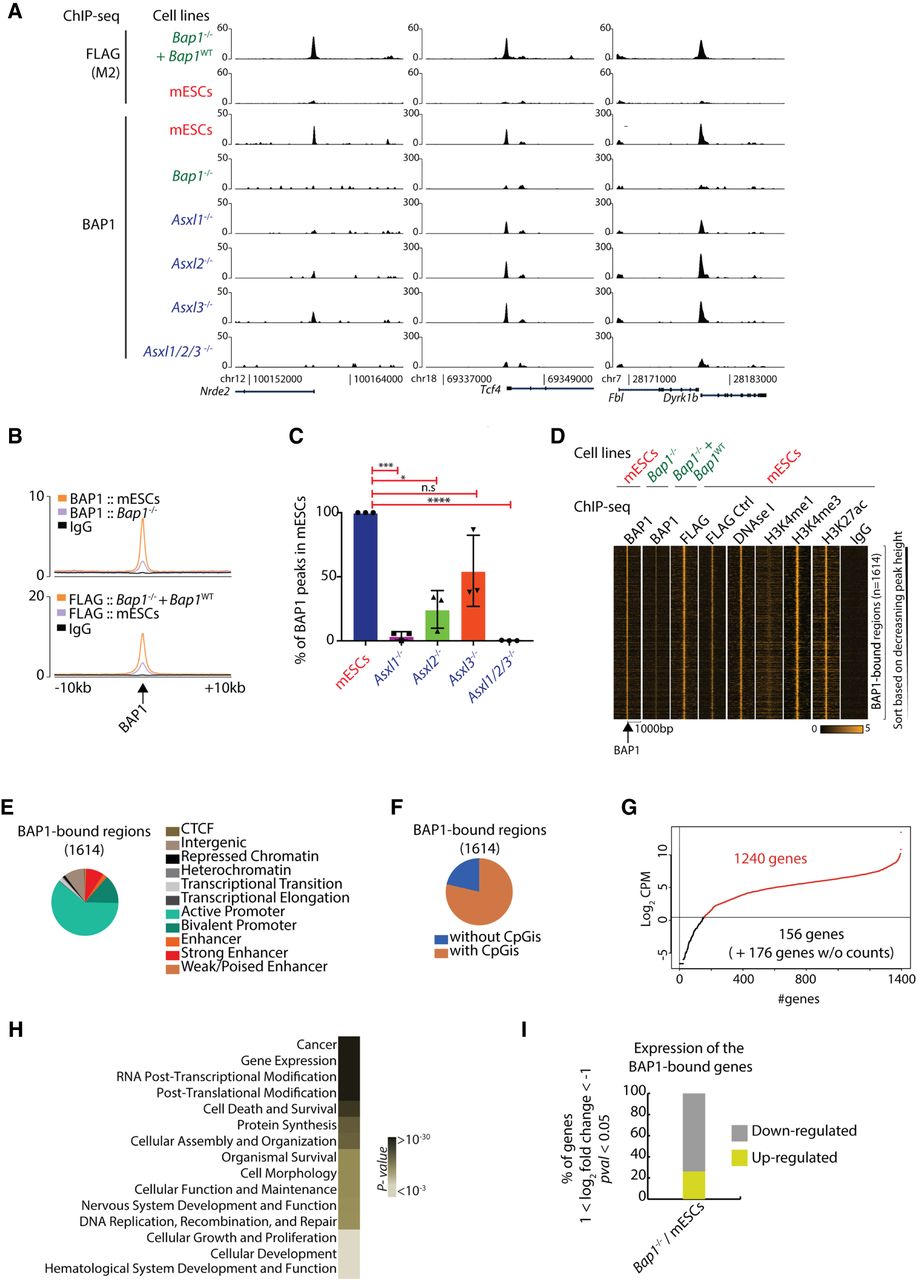
BAP1 binds to active genes involved in key cellular processes in an ASXL1/2/3-dependent manner. (A) Screenshots for three representative loci showing ChIP-seq for 3×FLAG-BAP1 in Bap1−/−+ Bap1WT and wild-type mESCs (control; upper panel) and ChIP-seq for BAP1 in wild-type mESCs, Bap1−/−, Asxl1−/−, Asxl2−/−, Asxl3−/−, and Asxl1/2/3−/− mESCs. (B) Average profile of the BAP1 ChIP-seq in wild-type and Bap1−/− mESCs (upper) and 3×FLAG-BAP1 ChIP-seq in Bap1−/−+ Bap1WT and wild-type mESCs (bottom) signals in 20 kb around the BAP1-enriched regions. (C) Identification of the (percentage) BAP1 regions remaining in Asxl1−/−, Asxl2−/−, Asxl3−/−, and Asxl1/2/3−/− mESCs compared to wild-type mESCs (determined by three independent biological replicates). Unpaired t-test with Welch correction. (*) P-value = 0.0124; (***) P-value = 0.0004; (****) P-value < 0.0001. (D) Heat maps illustrating the signal of the indicated ChIP-seq profiles (BAP1, FLAG for BAP1, DNase I, H3K4me1, H3K4me3, H3K27ac, and IgG) in 2 kb around the 1614 identified BAP1-enriched regions. (E) Hidden Markov analysis for the 1614 BAP1 positions in mESCs and organization in the 11 indicated categories. (F) Identification of the enrichment of CpG islands (CpGi) for the 1614 BAP1 positions. (G) Log2-normalized mean counts of mapped reads for the 1572 BAP1-bound genes; 1240 genes are expressed and have an adequate number of mapped reads (log2 CPM ≥ 0.5). (H) BAP1 target genes as divided by the most significant GO terms. (I) Differential expression profile of the statistically significant BAP1-bound genes in Bap1−/− mESCs versus wild-type mESCs. The criteria for the selected genes are: 1 ≤ log2 fold change ≤ −1, P-value ≤ 0.05, log2 CPM in mESCs ≥ 0.5 (down-regulated genes) or log2 CPM in KO ≥ 0.5 (up-regulated genes).


