
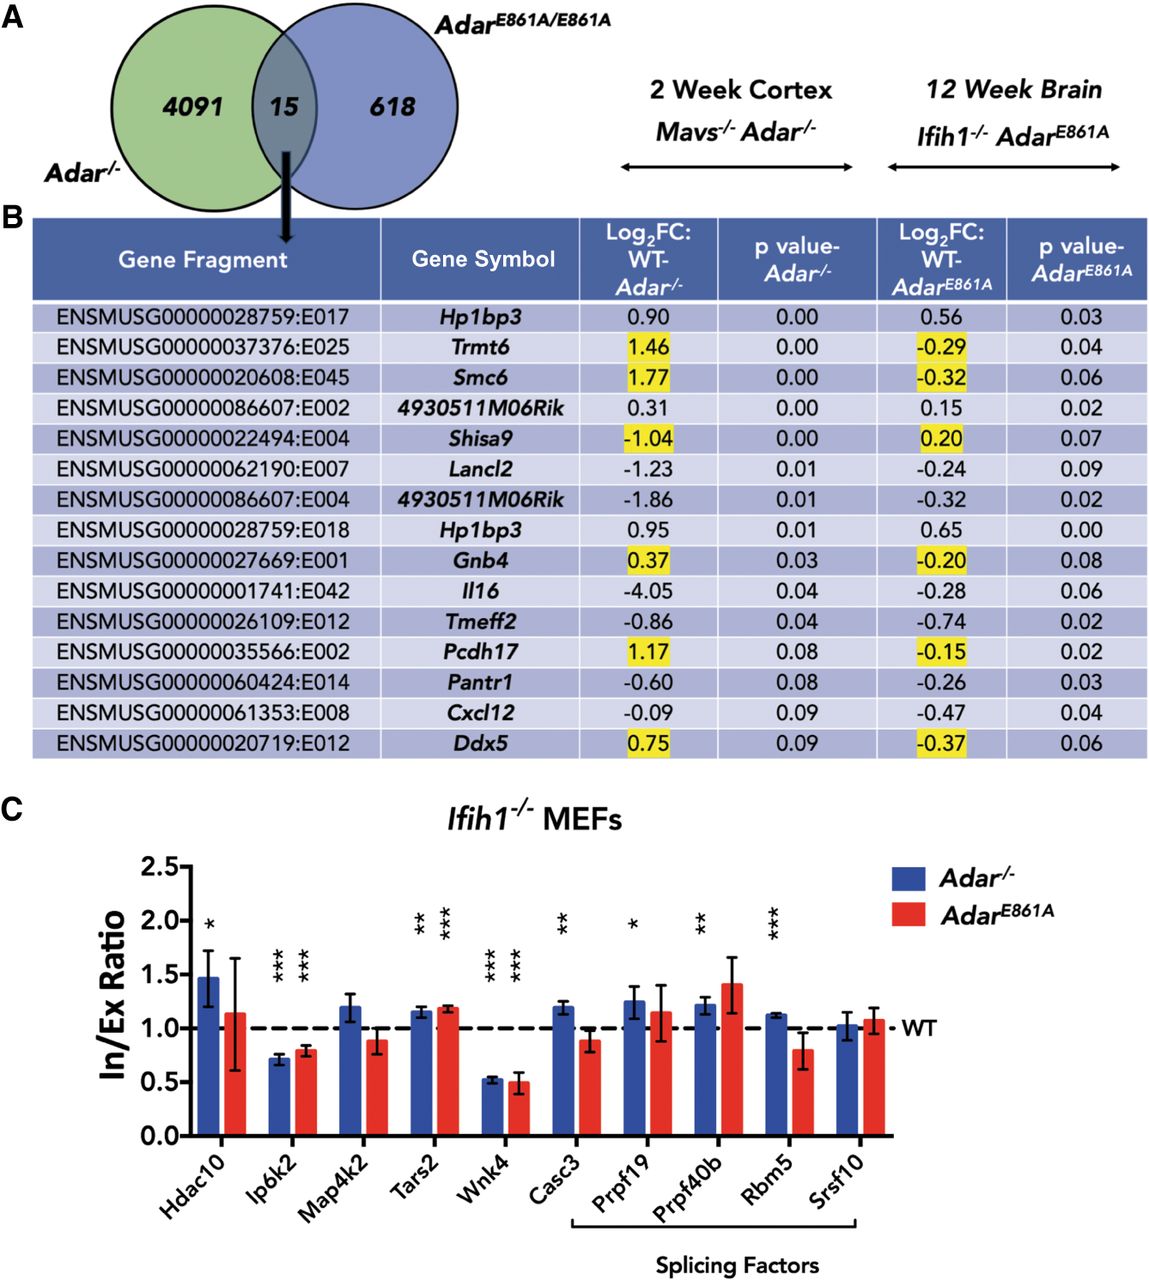
Figure 5.
ADAR can impact splicing in an editing-independent manner. (A) Venn diagram comparing DEXSeq output of Adar−/− cortex and editing-deficient AdarE861/E861A brain. (B) Table of DEXSeq events common between Adar−/− cortex and AdarE861/E861A brain. Genes with opposite trends in the direction of change are highlighted in yellow. Log2FC > 0 indicates higher quantity in WT and Log2FC < 0 indicates higher quantity in knockout. (C) Histogram showing qPCR validation of splicing events in IFIH1-rescued MEFs. Data shown are mean inclusion to exclusion ratio in Adar−/− and AdarE861A/E861A (±SD) relative to Adar+/+. Statistical test performed was Student's t-test; (*) P < 0.05, (**) P < 0.01, (***) P < 0.001.


