
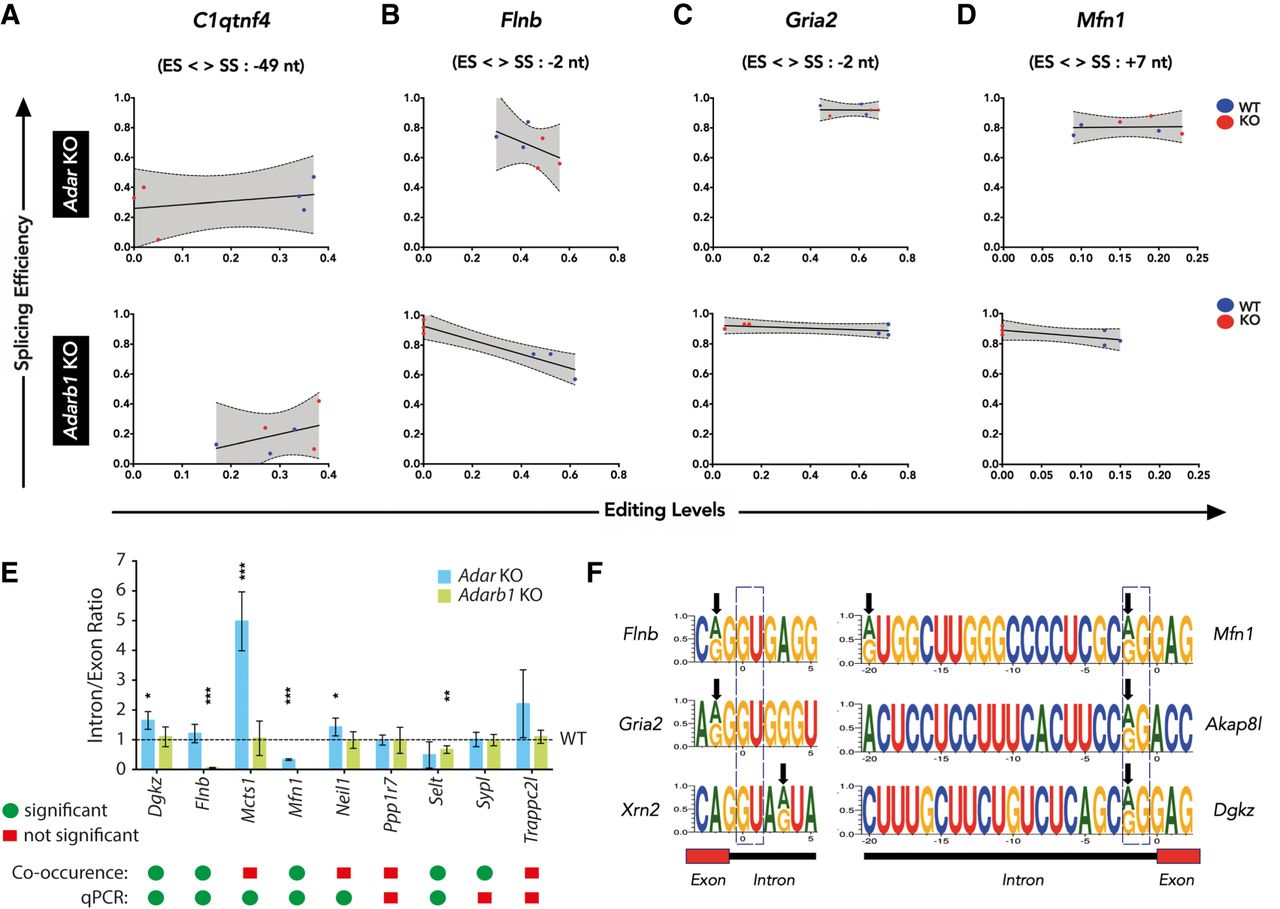
Nearby editing and splicing events are frequently linked. (A–D) Linear regression of co-occurrence analysis comparing editing levels and splicing levels of C1qtnf4, Flnb, Gria2, and Mfn1 in Adar KO and Adarb1 KO cortex samples. WT samples are shown in blue and KO samples are shown in red. The editing site position (ES) relative (upstream: +, or downstream: −) to the splice site position (SS) is given. (E) Histogram showing qPCR validation of targets identified by co-occurrence analysis in Adar KO and Adarb1 KO cortex. Data shown are mean inclusion to exclusion ratio (±SD). Statistical test performed with Student's t-test; (*) P < 0.05, (**) P < 0.01, (***) P < 0.001. A comparison of the significance found in the co-occurrence analysis of NGS data by Fisher's exact test and the output of the qPCR experiments as calculated by Student's t-test. Green dots = significant; red squares = not significant. (F) Schematic representing examples of positions of editing sites in the 5′ splice sites of Flnb, Gria2, and Xrn2 as well as in the 3′ splice sites of Mfn1, Akap8l, and Dgkz. Black arrows show the location of editing sites. A dotted box highlights the canonical 5′ GU and 3′ AG splice sites.


