
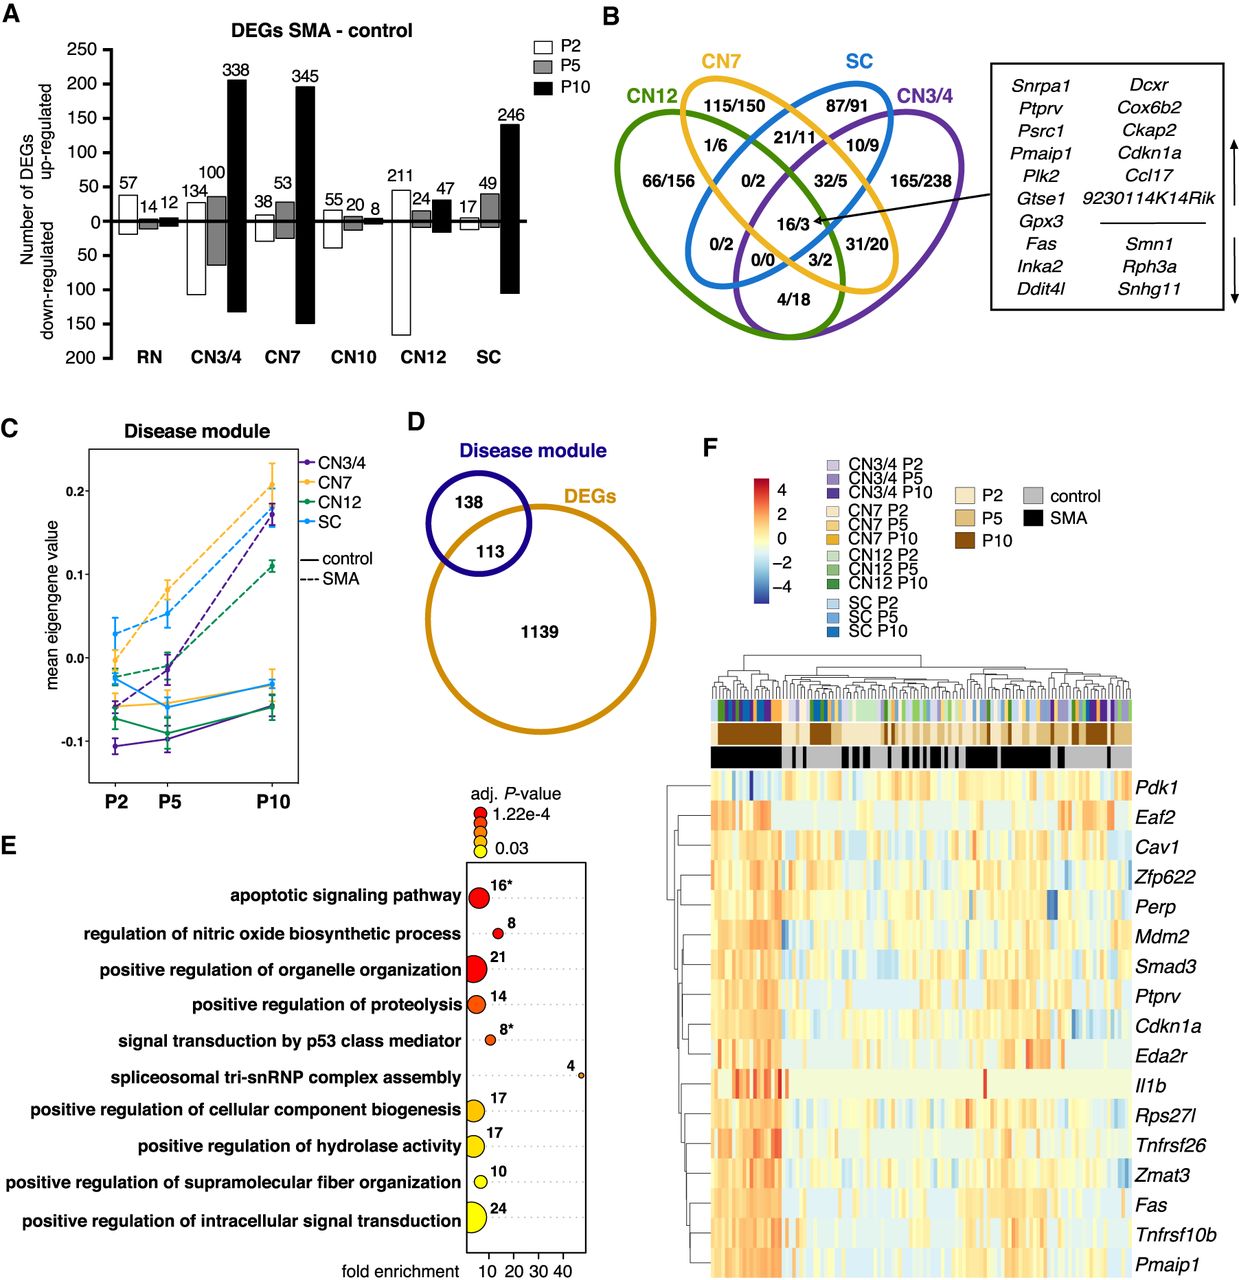
Analysis of disease-induced gene expression changes in SMA somatic motor neurons. (A) Number of significant genes from pairwise differential expression analysis per cell type and time point (DEGs, no fold-change cutoff, Padj < 0.05). Numbers on bars represent total numbers of DEGs. (B) Venn diagram depicting the overlap in gene expression changes between somatic motor neurons (number of up-/down-regulated genes in SMA, all time points combined). (C) Mean eigengene values (first principal component of the disease module) within replicates. (D) Venn diagram depicting the overlap between genes in the disease module and DEGs. (E) GO term analysis for biological processes of the 251 genes in the disease module. Shown are selected GO terms; a complete list of enriched terms can be found in Supplemental Table S9. Numbers indicate the number of genes in a given term, color scale is the adjusted P-value. Asterisks indicate gene sets that are plotted in F. (F) Expression heatmap of genes that belong to GO terms related to apoptosis and TRP53 signaling. Expression values were log2-transformed and mean centered.


