
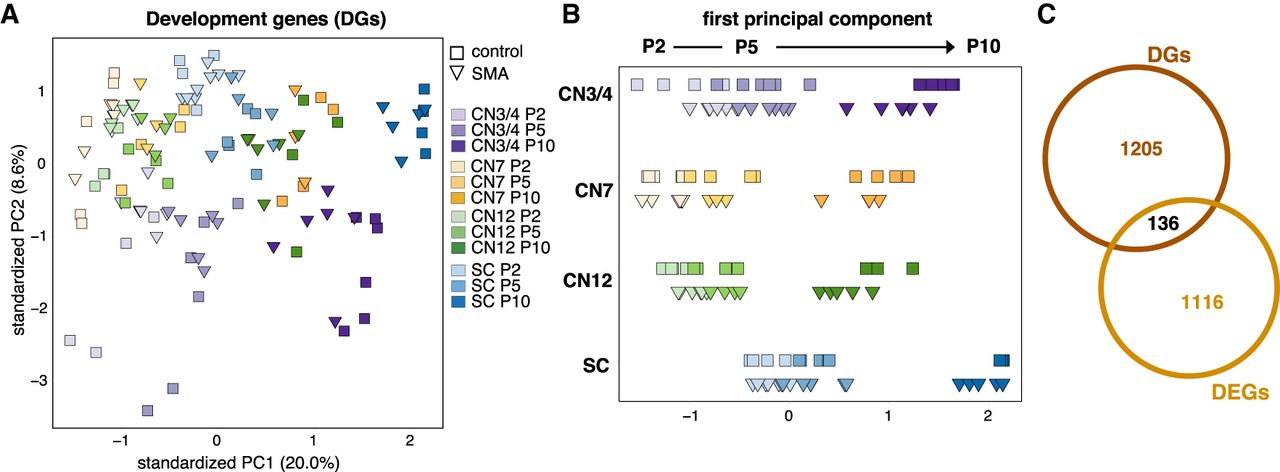
Figure 2.
Evaluation of the developmental state of SMA somatic motor neuron somas. (A) PCA with development-related genes (DGs, 1341 genes) of all somatic motor neurons in control and SMA. (B) Plot of PC1 alone to better visualize the “age component.” (C) Venn diagram depicting overlap between DGs and all differentially expressed genes between control and SMA (DEGs, no fold-change cutoff, Padj < 0.05) per cell type and time point.


