
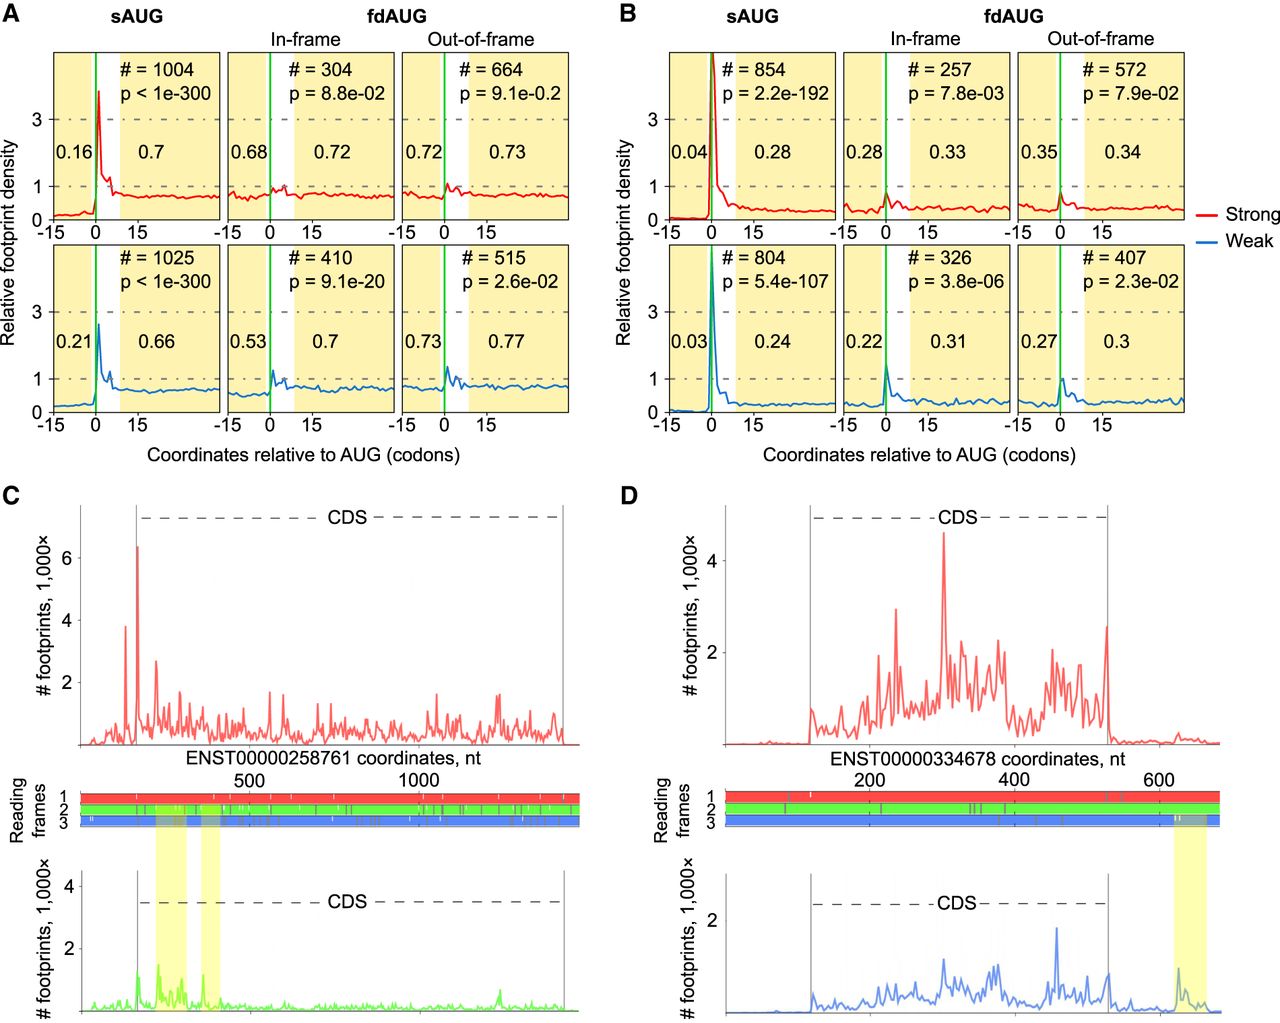
Analysis of ribosome profiling densities. (A) Relative ribosome footprint density (1 corresponds to average CDS density) surrounding sAUGs and fdAUGs. The areas used for calculating footprint density are highlighted, and the median density is indicated. The number of transcripts (#) used for generating metagene profiles as well as P-values as a measure of statistical significance (Mann–Whitney U test) are indicated at the top. (B) Same as A but for ribosome profiling data obtained with the methods that enrich footprints from initiating ribosomes. In this case, the size of the peak at AUG is more informative. (C) Subcodon ribosome footprint profiles for a BZW2 transcript variant. (Top) Density profile of footprints supporting translation of CDS Frame 1; (bottom) density profile of footprints supporting translation of alternative reading frame; (middle) ORF plot with white dashes indicating AUG codons and gray dashes indicating stop codons. The colors used to indicate reading frames match subcodon profiles supporting translation of corresponding frames. Nested ORFs whose translation is supported by ribosome profiling data are highlighted in yellow. (D) Subcodon profile of RPS19BP1 transcript variant. In this case, fdAUG and corresponding ORF whose translation is supported with ribosome profiling data occurs downstream from the CDS.


