
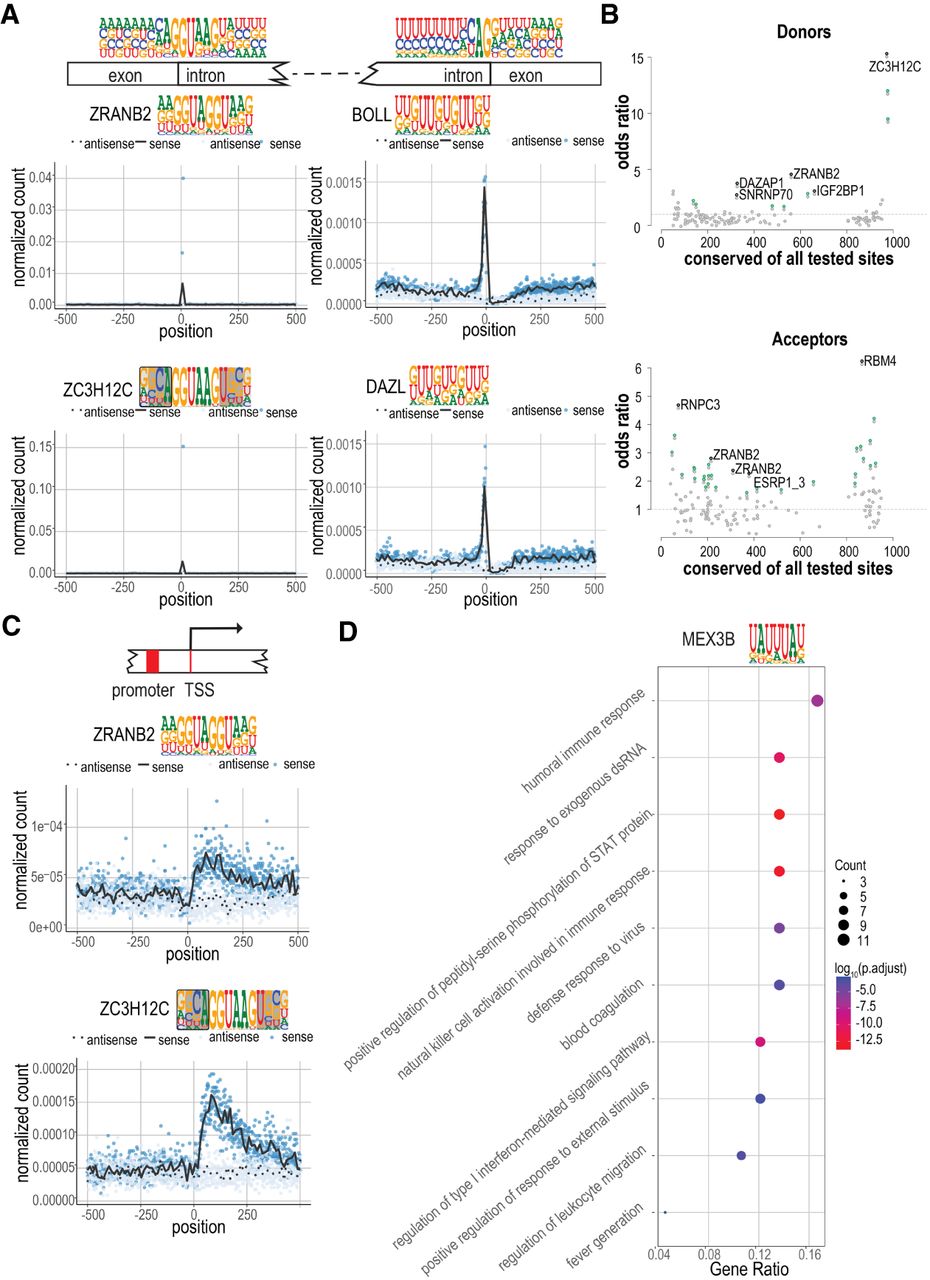
RBP motif matches are conserved and enriched in distinct sequence features and classes of transcripts. (A) Strong enrichment of RBP motif matches at or near the splicing donor and acceptor sites. Mononucleotide frequencies at splice donor and acceptor sites are shown on top, above the gene schematic. (Left) Meta-plots indicate the enrichment of ZRANB2 and ZC3H12C motif matches at splice donor sites. (Right) Enrichment of BOLL and DAZL at splice acceptor sites. Blue dots indicate the number of matches in the sense strand at each base position; black line indicates the locally weighted smoothing (LOESS) curve in 10-base sliding windows. Corresponding values for the antisense strand are shown as light blue dots and dotted black line, respectively. (B) The conservation of motif matches in sense versus antisense strand. Odds ratio of preferential conservation of a match in the sense strand (y-axis) is shown as a function of the total number of conserved motif matches (x-axis) (for details, see Methods). Motifs for which conservation is significantly associated with sense strand (one-sided Fisher's exact test) are shown in green. The five motifs with the smallest P-values are indicated in black and named. (C) Enrichment of ZRANB2 and ZC3H12C motif matches near transcription start sites (TSSs). Note that matches are only enriched on the sense strand downstream from the TSS. (D) Gene Ontology (GO) enrichment of MEX3B motif matches. The top 100 genes with highest motif-matching score density were used to conduct the GO enrichment analysis. The enriched GO terms were simplified by their similarity (cutoff = 0.5). The fraction of genes and their counts in the GO categories are also shown (gene ratio, count, respectively).


