
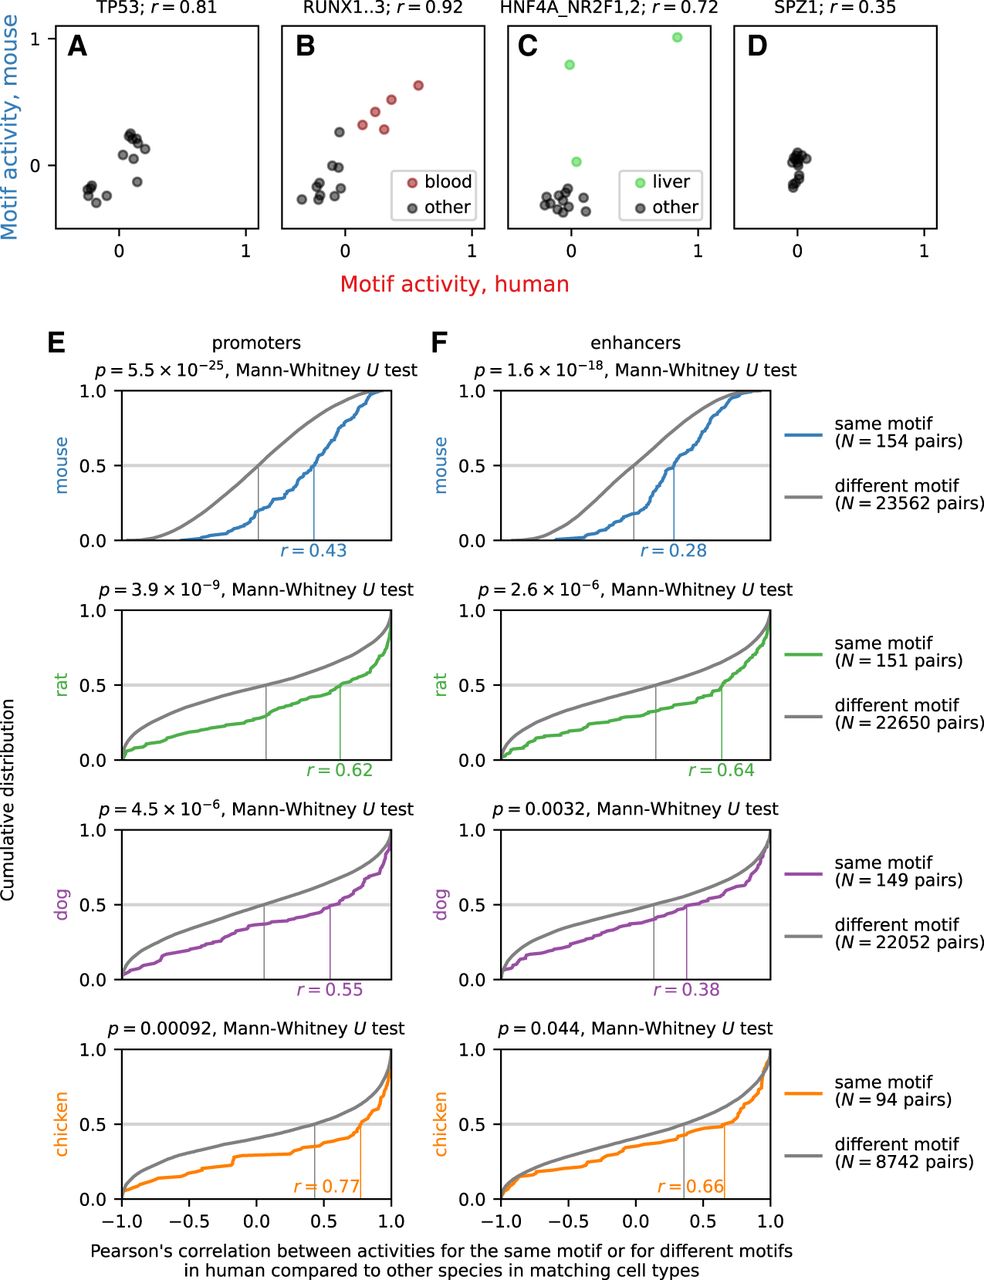
Motif Activity analysis. (A–D) Examples of calculated motif activities in human and mouse for motifs associated with the broadly expressed transcription factor TP53 (A), the hematopoietic lineage-specific RUNX transcription factors (B), the hepatocyte-specific HNF4A transcription factor (C), and the testis-specific transcription factor SPZ1 (D). Each of the 15 matching cell types between human and mouse is shown as a dot. The blood cell types CD19+ B cells, CD4+ T cells, CD8+ T cells, common myeloid progenitors, and granulocyte macrophage progenitors are shown in red for the RUNX motif, and the liver cell types hepatic sinusoidal endothelial cells, hepatic stellate cells (lipocytes), and hepatocytes are shown in green for the motif associated with HNF4A. (E,F) Cumulative distribution of Pearson's correlation r across cell types in motif activity for promoters (E) and enhancers (F) between human and mouse, rat, dog, and chicken. The estimated median value of r is indicated on the horizontal axis of each graph. As a background distribution, we calculated the same correlation between pairs of different motifs in human and mouse, rat, dog, and chicken. The Mann–Whitney U test P-value comparing the actual correlation values to the correlation values of the background distribution is shown for each comparison.


