
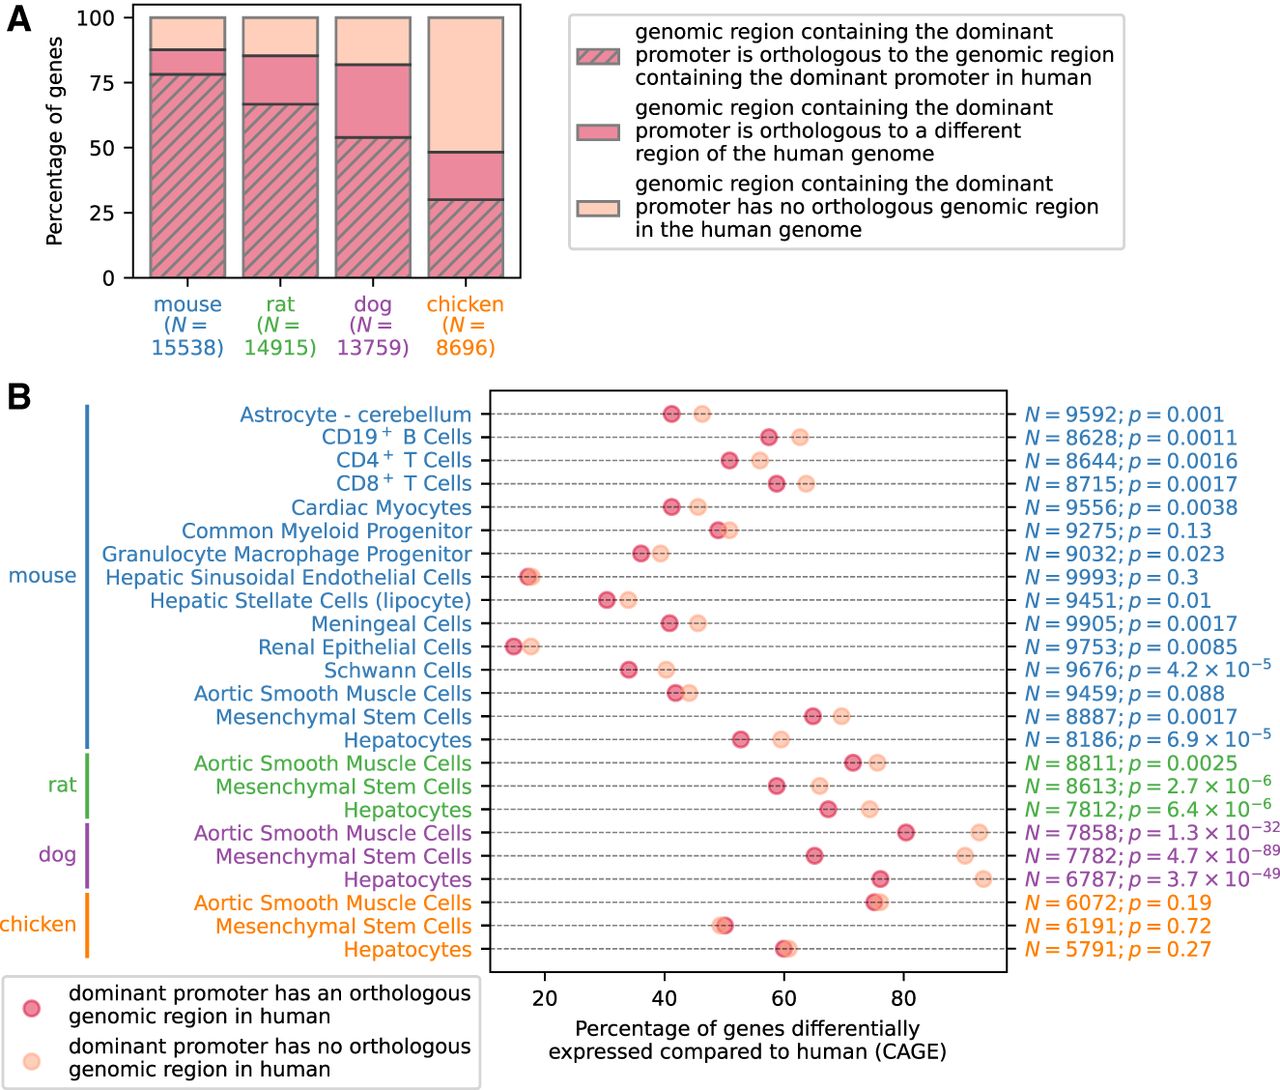
Promoter analysis of differentially expressed genes. (A) Percentage of genes in mouse, rat, dog, and chicken for which the dominant promoter was located in a genome region that had an orthologous genome region in human, and the percentage that the orthologous region contained the dominant promoter for the orthologous gene in human. (B) Percentage of differentially expressed genes in each cell type depending on whether the genomic region of the dominant promoter in each species had an orthologous genomic region in the human genome. The one-sided P-value calculated using Fisher's exact test is shown on the right, together with the number N of expressed genes in each cell type.


