
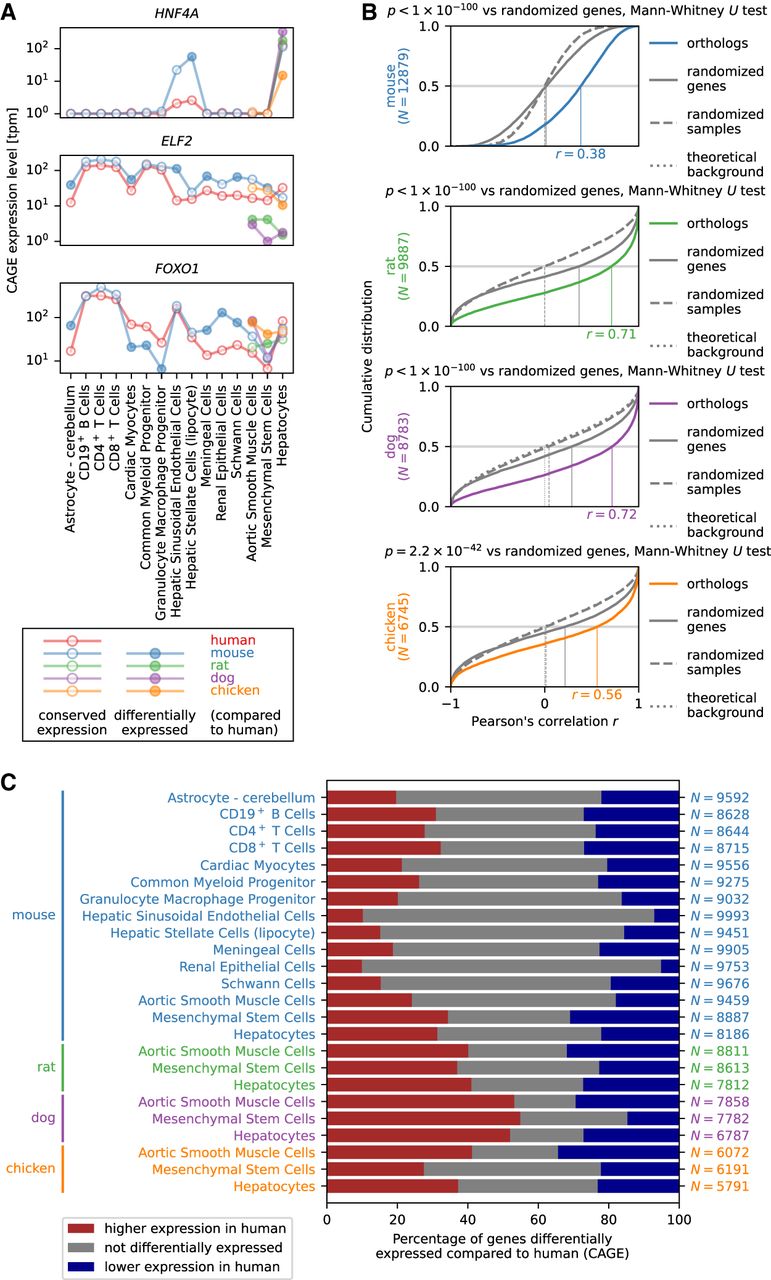
Differential gene expression analysis. (A) Expression profile of HNF4A, ELF2, and FOXO1 as examples of genes with an expression profile highly correlated across cell types between species but with significant expression level differences between species in specific cell types. (B) Cumulative distribution of Pearson's correlation r across cell types in gene expression between human and mouse, rat, dog, or chicken. The number N of expressed orthologous genes included in the distribution is shown in the vertical axis label, and the estimated median value of r is indicated on the horizontal axis of each graph. The background distribution of r obtained by randomizing genes (solid curve) or randomizing samples (dashed curve) as well as the theoretical background distribution of r for an uncorrelated bivariate normal distribution (dotted curve) are shown in gray; the latter two largely coincide. The statistical significance was calculated using the Mann–Whitney U test comparing Pearson's correlation values for orthologs to the background distribution of r for randomly paired genes between human and mouse, rat, dog, or chicken. Note that the median correlation values are not directly comparable between species, as the sets of orthologous genes are different. (C) Differential gene expression analysis of orthologous genes in human compared to mouse, rat, dog, and chicken. The red and blue bars correspond to the percentage of expressed orthologous genes with significantly (Benjamini–Hochberg corrected P < 0.1) higher and lower expression, respectively, in human compared to mouse, rat, dog, or chicken. The number N of orthologous genes expressed in each cell type is shown on the right.


