
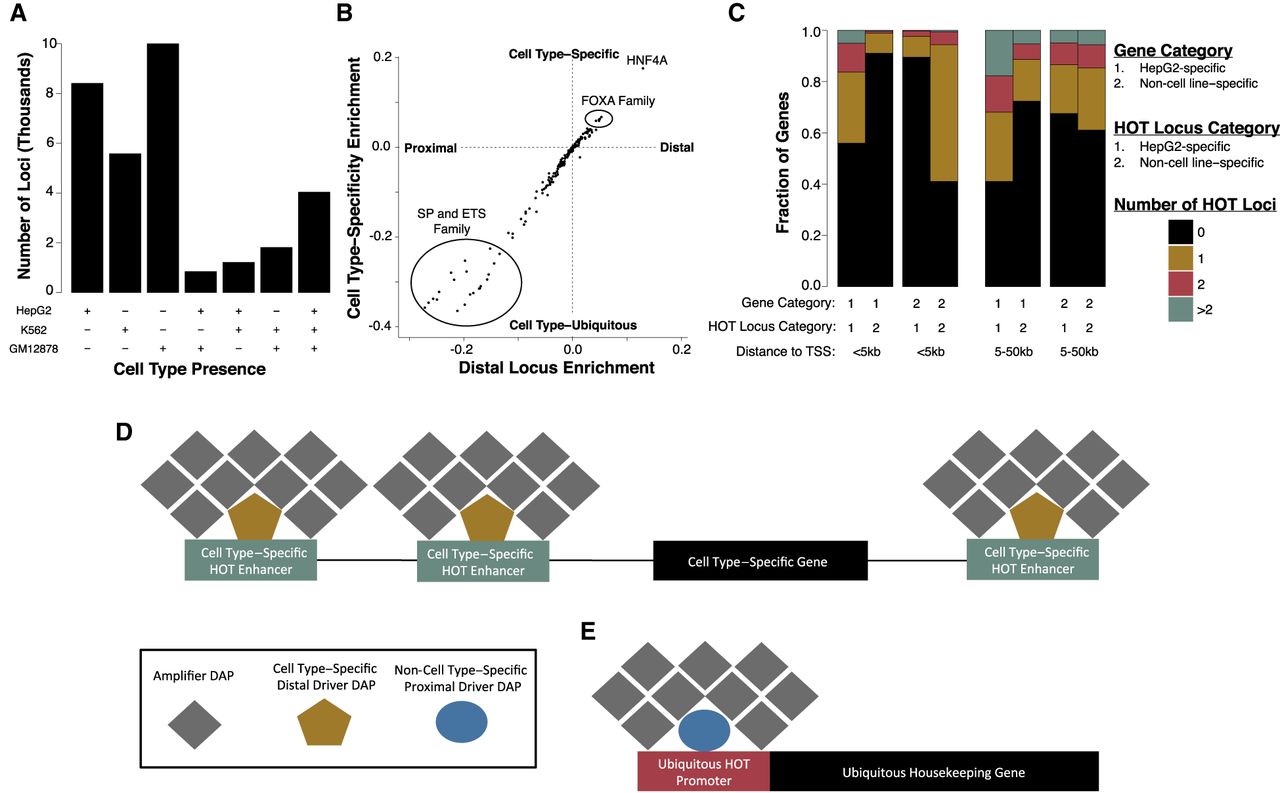
HOT loci dichotomize into cell type–specific or ubiquitous groups. (A) The number of HOT loci present in all possible combinations of each cell line. (B) Scatter plot showing the association between cell type–specific HOT loci enrichment and distal, HOT loci enrichment in HepG2. Cell type specificity enrichment value is computed by subtracting the fraction of HepG2-specific HOT loci (N = 7692) in which a DFM is present from the fraction of non-HepG2-specific HOT loci (N = 6100) in which a DFM is present. The distal locus enrichment is computed by subtracting the fraction of HOT loci >5 kb from the nearest TSS (N = 6445) in which a DFM is present from the fraction of HOT loci <5 kb from the nearest TSS in which a DFM is present (N = 7347). (C) Stacked bar plots displaying the proportion of cell type–specific or expression level–matched, non-cell type–specific genes that possess a specified number of neighboring cell type–specific or non-cell type–specific HOT loci at a specified distance to TSS threshold. Cell type–specific genes were computed by randomly sampling 500 genes that were expressed at least fourfold higher in the cell line of interest than the other two cell lines and had an FPKM of at least five in the cell line of interest. Non-cell type–specific genes were a cell type–specific gene expression level–matched sample of 500 genes with an FPKM of at least five in HepG2, K562, and GM12878. (D,E) Proposed model of how HOT loci relate to cell type–specific (D) and non-cell type–specific housekeeper gene (E) expression.


