
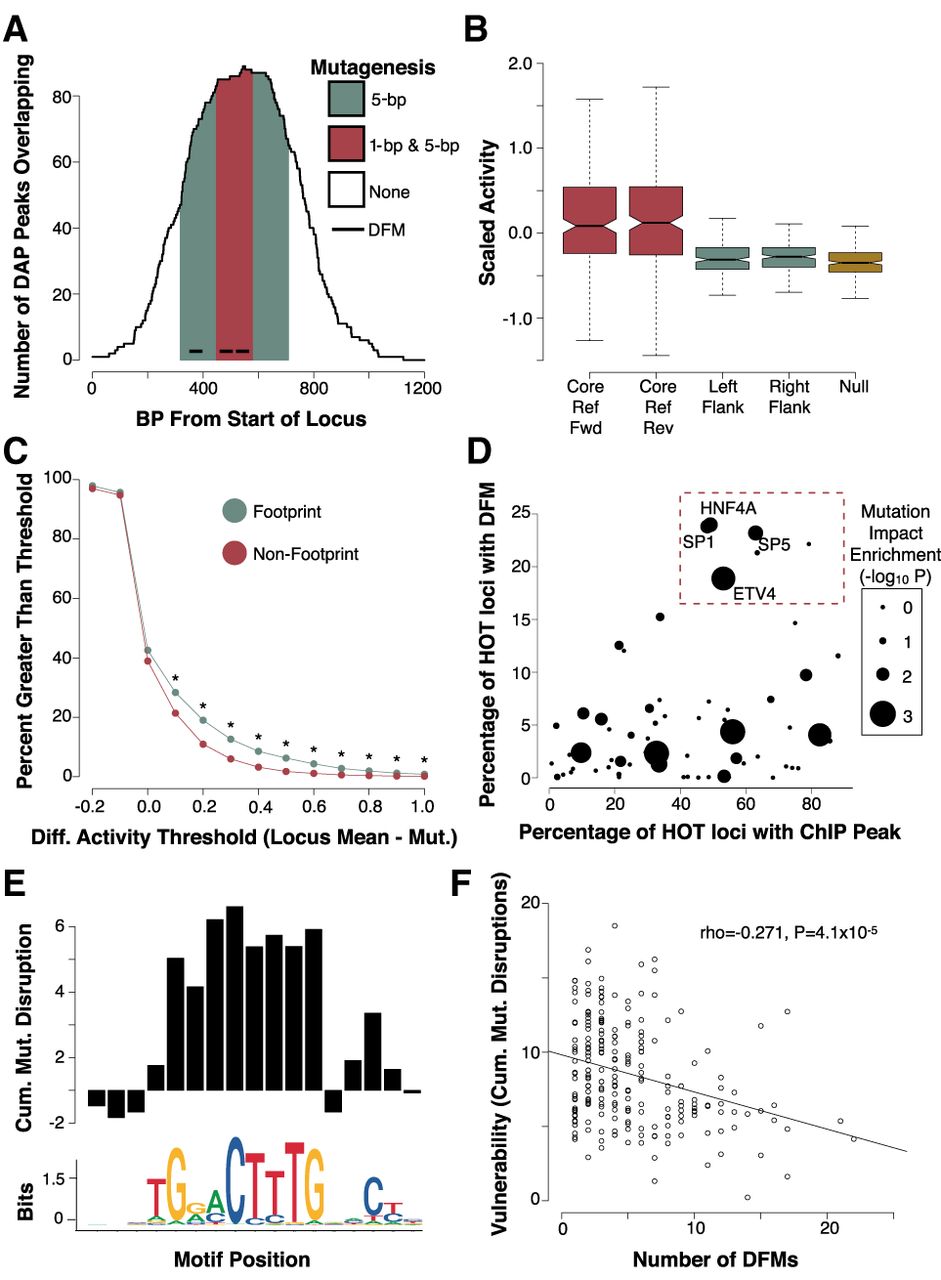
High-throughput mutagenesis of HOT loci reveals motifs driving activity. (A) Example locus depicting mutagenesis schema. The red region indicates a 130-bp core, centered upon the maximum number of unique ChIP-seq peaks and DFMs, in which we performed tiled single-bp and 5-bp mutagenesis in both the forward and reverse orientation. The flanking green regions represent 130-bp sequences flanking the core region in which we performed tiled 5-bp mutagenesis in the forward orientation only. (B) Boxplots indicating activity (as represented by the RNA/DNA ratio) was largely concentrated in the WT core loci in both the forward and reverse orientations and not in flanking regions or null regions (Wilcoxon P < 510 × −16). (C) Plot indicating the proportion of mutations imposing a change of activity at a variety of thresholds for 5-bp mutations. Green points indicate data for mutations falling within DHS footprints. Red points indicate data for mutations falling outside of DHS footprints. An asterisk indicates Fisher's P < 0.05. (D) Scatter plot showing the fraction of HOT sites that contain an ssTF ChIP peak and DFM. TFs highlighted in the top right are putative direct binding TFs associated with a high proportion of HOT sites. The size of each point corresponds to an ssTFs DFM enrichment for high-impact mutations in our mutagenesis assay. (E) Barplot showing the cumulative differential activity (locus mean – mutation) across all positions in the HNF4A motif. (F) Scatterplot showing the number of nonredundant DFMs at a locus is inversely correlated with its vulnerability to mutation (expressed as the sum of all mutation delta activity scores).


