
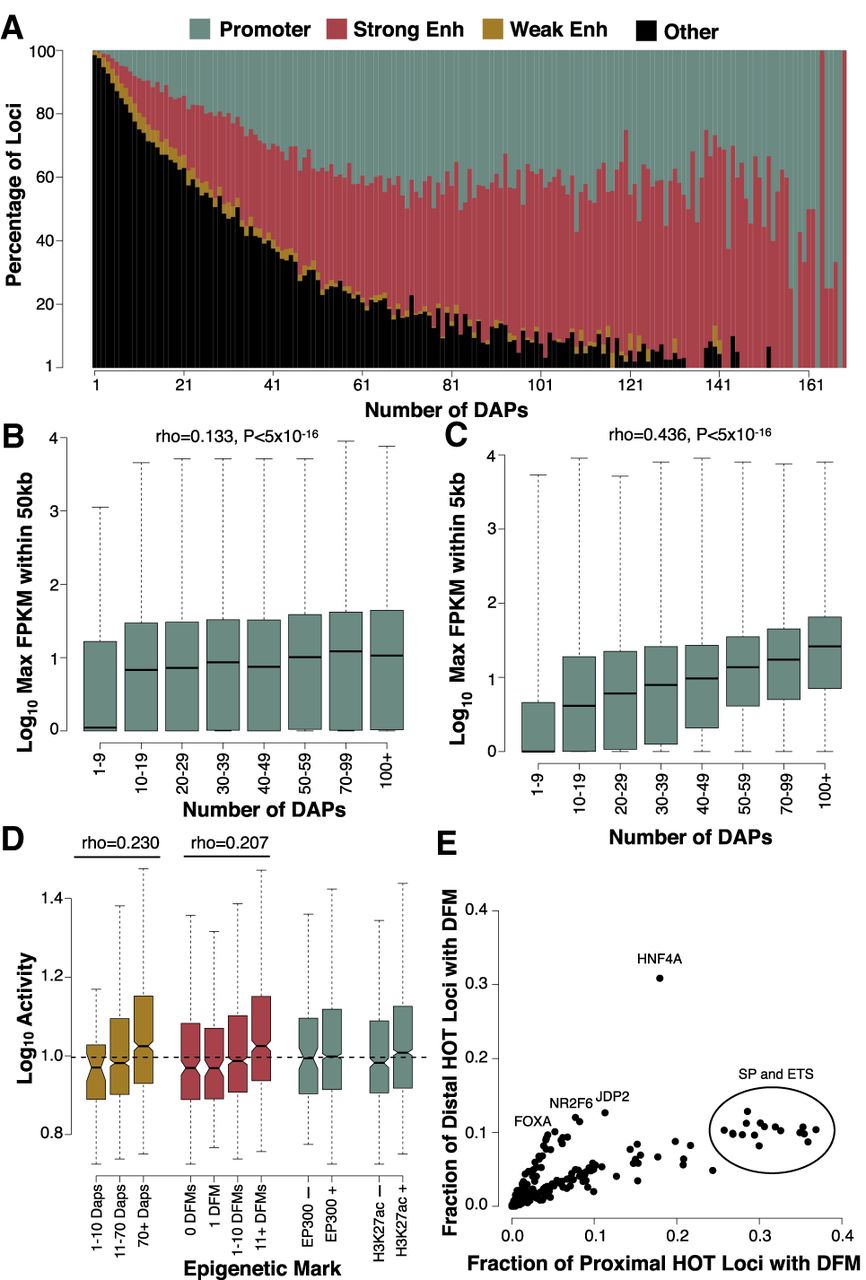
HOT loci are enriched for promoter and enhancer regions near highly expressed genes. (A) IDEAS annotations of loci binned by ChIP-defined DAP associations. Promoter, strong enhancer, and weak enhancer annotations represent 0.27%, 0.35%, and 0.22% of the HepG2 genome, whereas the remaining 99.16% of the genome (largely consisting of quiescent and repressed annotations) was used for the “other” annotation. (B,C) The expression level of the maximally expressed gene neighboring each locus binned by the number of ChIP-defined DAP associations. Plots show loci either distal (>5 kb; B) or proximal (<5 kb; C) to their nearest gene. The sample size of each bin is as follows: 1–9 (N = 194,028), 10–19 (N = 17,148), 20–29 (N = 8685), 30–39 (N = 5876), 40–49 (N = 4578), 50–69 (N = 6532), 70–99 (N = 5351), 100+ (N = 2706). (D) ChIP- and DFM-defined coassociation correlates with activity in a previous high-throughput reporter assay conducted on approximately 2000 selected enhancer regions in HepG2. (E) Scatter plots showing the fraction of distal (>5 kb from a TSS) and proximal (<5 kb from a TSS) HOT sites that contain a DFM for each ssTF in HepG2.


