
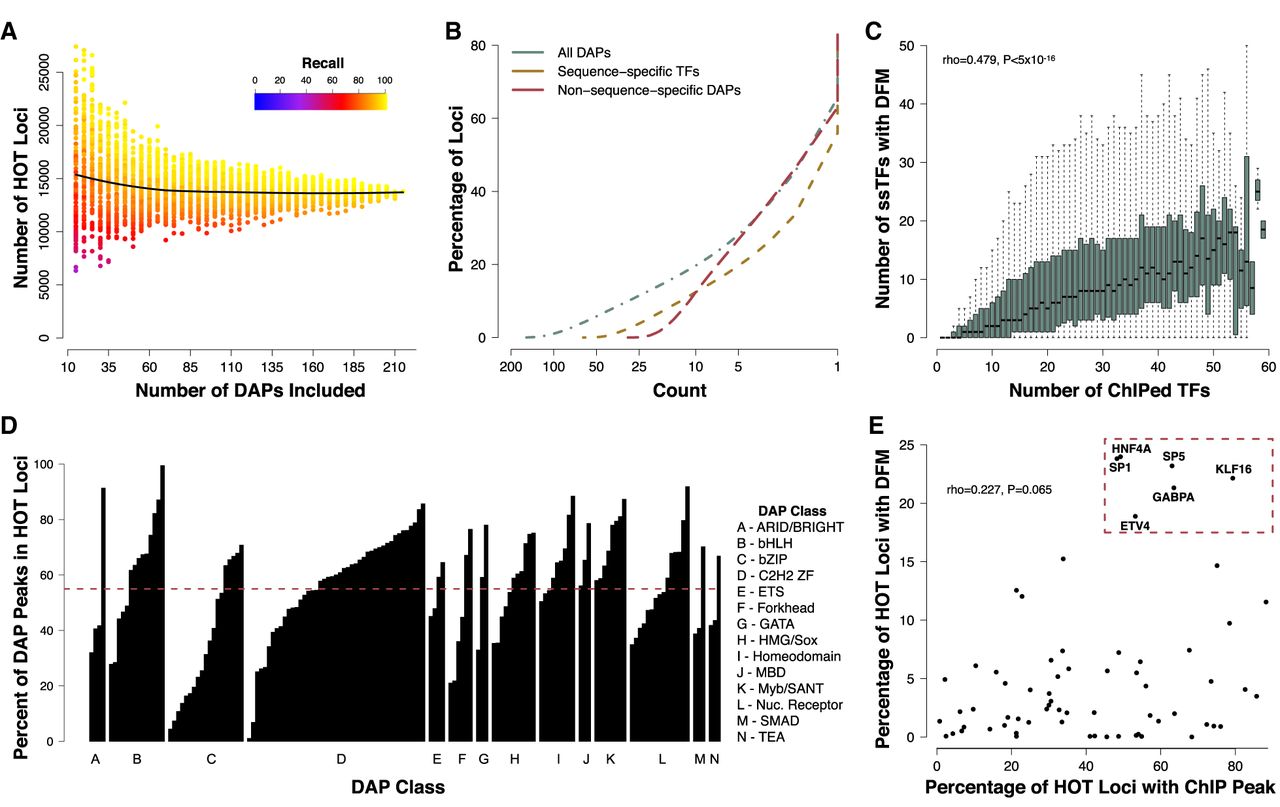
HOT loci are prevalent throughout the genome. (A) Number of loci reaching “HOT” threshold of 25% of unique ChIP-seq peaks after performing random down-sampling (from the original 208) of the number of DAPs included. Each data point represents the result of a random sampling of a specified number of DAPs. The color indicates the recall performance or the percentage of true HOT sites, as defined by >25% of DAPs bound in the full data set, detected with current sample of DAPs. The black line represents the median result of 100 random samples of each number of DAPs as specified by the x-axis. (B) Cumulative distribution function (CDF) showing the proportion of loci containing at least a given number of unique DAP ChIP-seq peaks in HepG2. The green line shows data for all 208 DAPs; the red dashed line, data for nssDAPs; and the yellow dashed line, data for ssTFs. (C) Boxplots showing the number of ChIP-defined DAPs with a corresponding DFM present at the same locus at various levels of DAP coassociation. (D) Barplots indicating the fraction of ChIP peaks for each DAP that fall within HOT loci. Bars are grouped by previously defined DAP classes. The dashed red line indicates the average fraction (55%) of ChIP peaks that fall within a HOT locus across all DAPs. (E) Scatter plot showing the fraction of HOT sites that contain a ssTF ChIP-seq peak and a DFM. ssTFs highlighted in the top right are putative driver TFs present at high proportion of HOT sites.


