
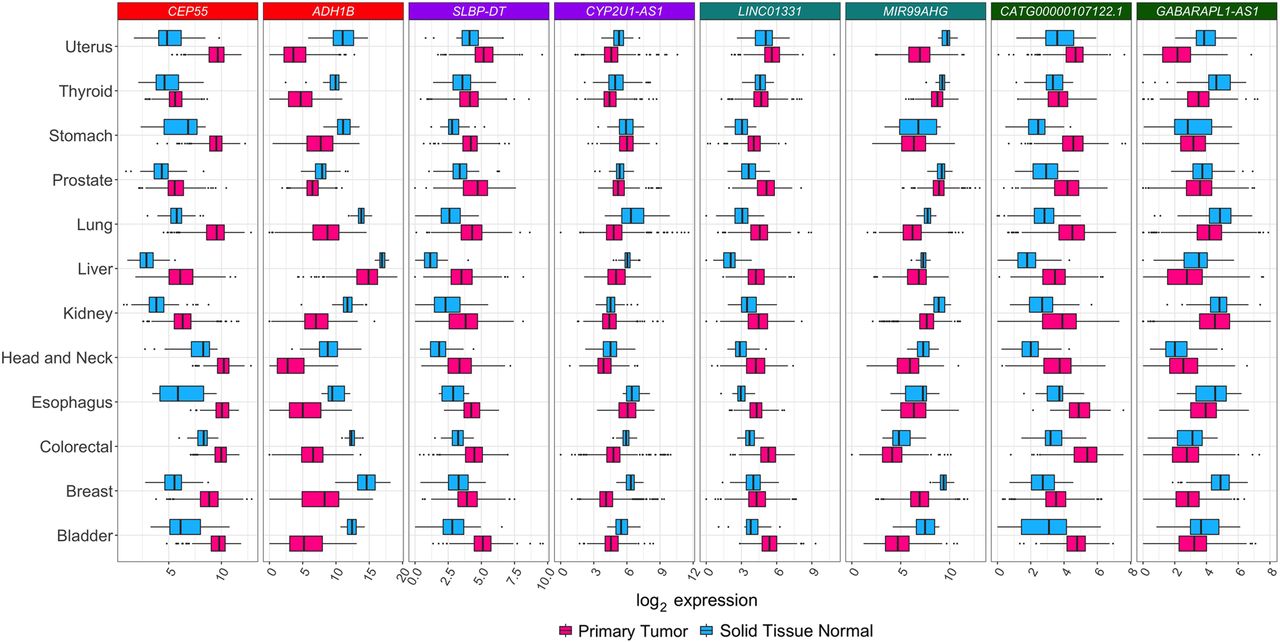
Differential expression for selected transcripts from distinct RNA classes across tumor types. Box plots for selected differentially expressed genes between tumor and normal samples across all 13 tumor types analyzed. For each tissue of origin, the most up-regulated (on the left) and down-regulated (on the right) gene for each RNA class is shown. Center lines, upper/lower hinges, and the whiskers, respectively, represent the median, the upper and lower quartiles, and 1.5 extensions of the interquartile range. Color coding on the top of the figure indicates the RNA classes (red for mRNA, purple for dp-lncRNA, cyan ip-lncRNA, and green for e-lncRNA). These genes were selected after global multiple testing correction across all 13 tumor types (see Supplemental Tables S1–S4).


