
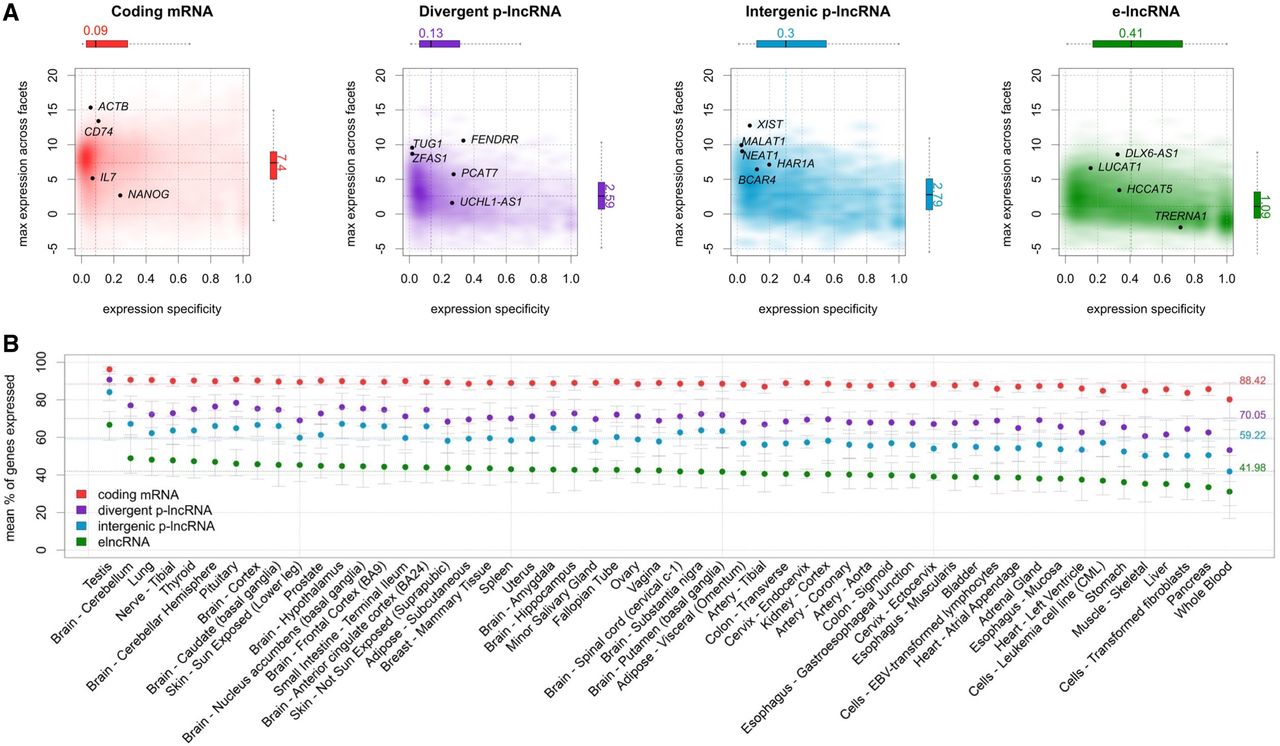
Expression profiles across GTEx tissues. (A) Expression level and tissue specificity across four distinct RNA categories. The y-axis shows log2 expression levels representing each gene using its maximum expression in GTEx tissues expressed as transcripts per million (TPM). The x-axis shows expression specificity based on entropy computed from median expression of each gene across the GTEx tissue types. Individual genes are highlighted in the figure panels. (B) Percentage of genes expressed for each RNA category stratified by GTEx tissue facets. The dots represent the mean among samples within a facet and the error bars represent 99.99% confidence intervals. Dashed lines represent the means among all samples.


