
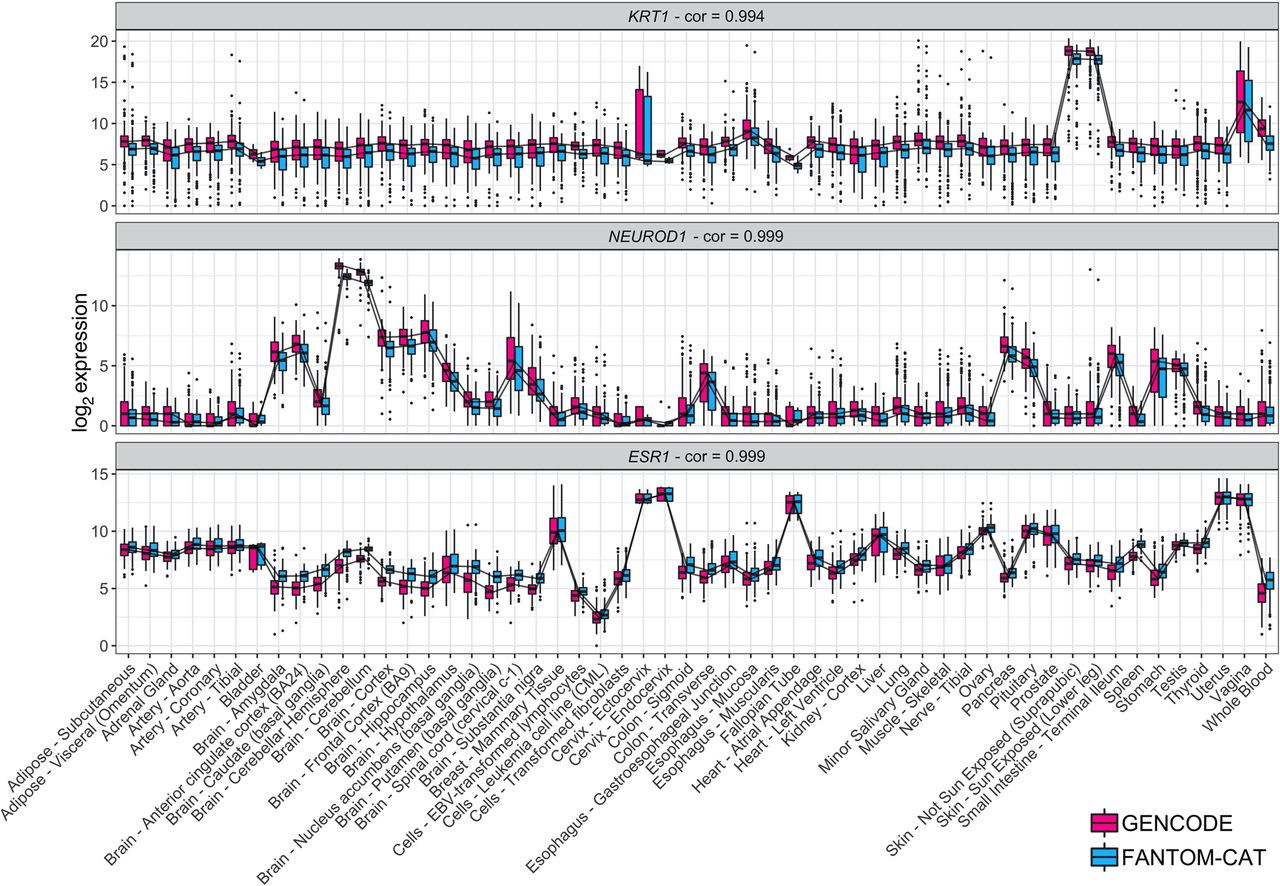
Tissue-specific expression in GTEx. Log2 expression for three tissue-specific genes (KRT1, NEUROD1, and ESR1) in GTEx data stratified by tissue type using FC-R2- and GENCODE-based quantification. Expression profiles are highly correlated and expressed consistently in the expected tissue types (e.g., KRT1 is most expressed in skin, NEUROD1 in brain, and ESR1 in estrogen-sensitive tissue types like uterus, Fallopian tubes, and breast). Correlations are shown on top for each tissue marker. Center lines, upper/lower quartiles, and whiskers represent the median, 25/75 percentiles, and 1.5 interquartile range, respectively. Additional tissue-specific markers are shown in Supplemental Figure S1.


