
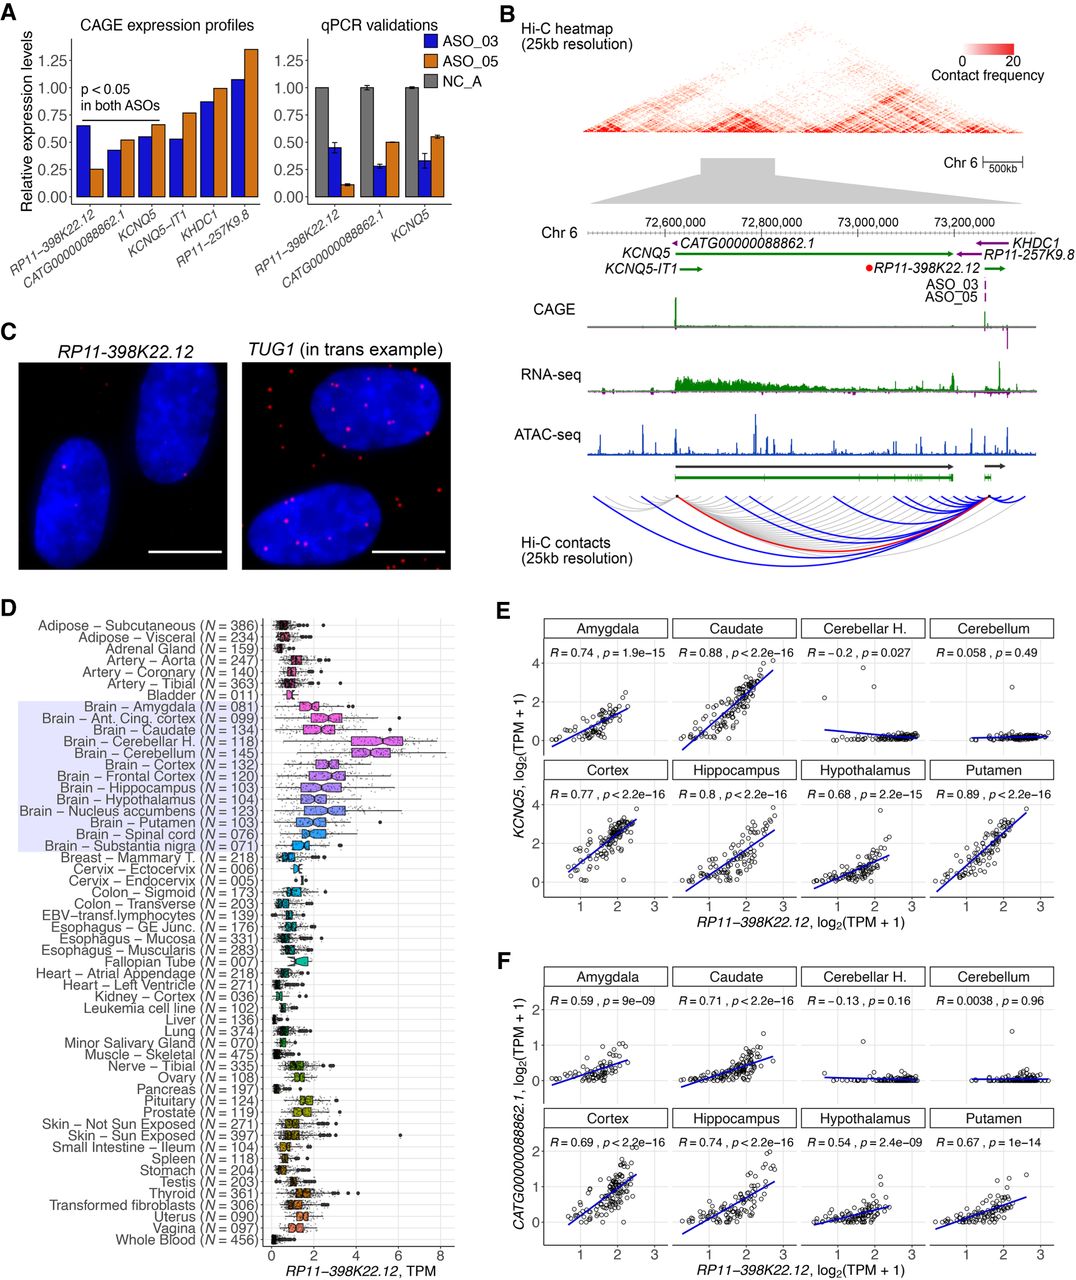
RP11-398K22.12 down-regulates KCNQ5 and CATG00000088862.1 in cis. (A) Changes in expression levels of detectable genes in the same topologically associated domain (TAD) as RP11-398K22.12 based on Hi-C analysis. Both KCNQ5 and CATG00000088862.1 are down-regulated (P < 0.05) upon the knockdown of RP11-398K22.12 by two independent ASOs in CAGE analysis (left) as further confirmed with RT-qPCR (right). (B) (Top) Representation of the chromatin conformation in the 4-Mb region proximal to the TAD containing RP11-398K22.12, followed by the locus gene annotation, CAGE, RNA-seq, and ATAC-seq data for native HDFs. (Bottom) Schematic diagram showing Hi-C predicted contacts of RP11-398K22.12 (blue) and KCNQ5 (gray) (25-kb resolution, frequency ≥ 5) in HDF cells. Red line indicates RP11-398K22.12 and KCNQ5 contact. (C) FISH image for RP11-398K22.12, suggesting proximal regulation. TUG1 FISH image (suggesting trans regulation) is included as a comparison; (bar = 10 µm). (D) GTEx atlas across 54 tissues (N = 9662 samples) shows relatively high expression levels of RP11-398K22.12 in 13 distinct brain regions samples (highlighted). (E) Expression correlation for RP11-398K22.12 and KCNQ5 in eight out of 13 distinct brain regions, as highlighted in D. (F) Expression correlation for RP11-398K22.12 and CATG00000088862.1 in eight out of 13 distinct brain regions, as highlighted in D.


